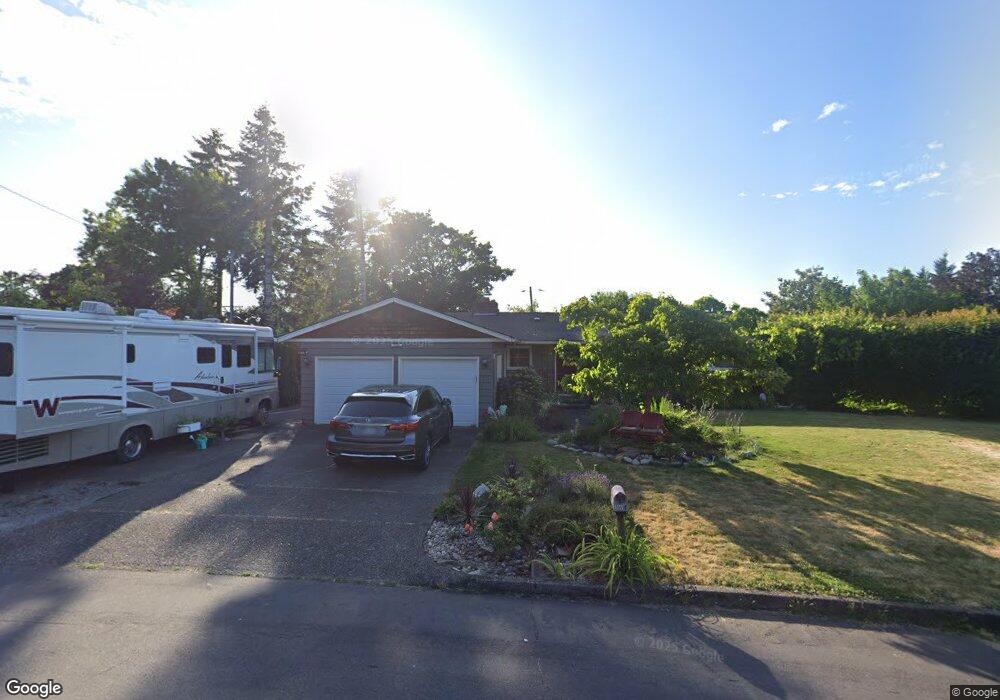
3009 SE 184th Place Gresham, OR 97030
Centennial-Gresham NeighborhoodEstimated Value: $500,000 - $526,000
4
Beds
3
Baths
2,700
Sq Ft
$189/Sq Ft
Est. Value
About This Home
This home is located at 3009 SE 184th Place, Gresham, OR 97030 and is currently estimated at $509,953, approximately $188 per square foot. 3009 SE 184th Place is a home located in Multnomah County with nearby schools including Lynch Meadows Elementary School, Centennial Middle School, and Centennial High School.
Ownership History
Date
Name
Owned For
Owner Type
Purchase Details
Closed on
May 6, 2025
Sold by
Strannigan Gregory and Strannigan Shawn
Bought by
Strannigan Family Trust and Strannigan
Current Estimated Value
Purchase Details
Closed on
Jan 20, 2017
Sold by
Blake Diana M
Bought by
Strannigan Gregory and Strannigan Shawn
Home Financials for this Owner
Home Financials are based on the most recent Mortgage that was taken out on this home.
Original Mortgage
$269,600
Interest Rate
4.19%
Mortgage Type
New Conventional
Purchase Details
Closed on
Jul 22, 2004
Sold by
Blake Ernest M
Bought by
Blake Diana M
Purchase Details
Closed on
Feb 11, 1999
Sold by
Davis Wayne H
Bought by
Blake Ernest Merritt and Blake Diana M
Home Financials for this Owner
Home Financials are based on the most recent Mortgage that was taken out on this home.
Original Mortgage
$162,019
Interest Rate
6.79%
Mortgage Type
VA
Purchase Details
Closed on
Jun 12, 1995
Sold by
Davis Janice L
Bought by
Davis Wayne H
Create a Home Valuation Report for This Property
The Home Valuation Report is an in-depth analysis detailing your home's value as well as a comparison with similar homes in the area
Home Values in the Area
Average Home Value in this Area
Purchase History
| Date | Buyer | Sale Price | Title Company |
|---|---|---|---|
| Strannigan Family Trust | -- | None Listed On Document | |
| Strannigan Gregory | $337,000 | First American | |
| Blake Diana M | -- | -- | |
| Blake Ernest Merritt | $157,300 | Pacific Nw Title | |
| Davis Wayne H | -- | Chicago Title |
Source: Public Records
Mortgage History
| Date | Status | Borrower | Loan Amount |
|---|---|---|---|
| Previous Owner | Strannigan Gregory | $269,600 | |
| Previous Owner | Blake Ernest Merritt | $162,019 |
Source: Public Records
Tax History Compared to Growth
Tax History
| Year | Tax Paid | Tax Assessment Tax Assessment Total Assessment is a certain percentage of the fair market value that is determined by local assessors to be the total taxable value of land and additions on the property. | Land | Improvement |
|---|---|---|---|---|
| 2025 | $5,250 | $277,210 | -- | -- |
| 2024 | $5,028 | $269,140 | -- | -- |
| 2023 | $5,028 | $261,310 | $0 | $0 |
| 2022 | $4,360 | $253,700 | $0 | $0 |
| 2021 | $4,376 | $246,320 | $0 | $0 |
| 2020 | $4,029 | $239,150 | $0 | $0 |
| 2019 | $4,053 | $232,190 | $0 | $0 |
| 2018 | $3,770 | $225,430 | $0 | $0 |
| 2017 | $3,644 | $218,870 | $0 | $0 |
| 2016 | $3,538 | $212,500 | $0 | $0 |
| 2015 | $3,443 | $206,320 | $0 | $0 |
| 2014 | $3,435 | $200,320 | $0 | $0 |
Source: Public Records
Map
Nearby Homes
- 4021 NW 3rd St
- 18615 SE Tibbetts Ct
- 18505 SE Clinton St
- 2629 SE 190th Ave
- 2549 SE 190th Ave
- 3667 SW 2nd St
- 2604 SE 176th Place
- 2728 SE 175th Place
- 2221 SE 185th Ave
- 17519 SE Tibbetts St
- 2211 SE 182nd Ave
- 2203 SE 184th Ave
- 2237 SE 189th Ave
- 2442 SE 190th Ave
- 3412 NW 1st St
- 2146 SE 185th Ave
- 2209 SE 178th Ave
- 3051 SE 171st Dr
- 17528 SE Marie St
- 4060 SW 8th St
- 18300 SE Brooklyn Ct
- 2987 SE 184th Place
- 18315 SE Tibbetts Ct
- 18244 SE Brooklyn Ct
- 18312 SE Brooklyn Ct
- 18343 SE Tibbetts Ct
- 3004 SE 184th Place
- 18245 SE Tibbetts Ct
- 18326 SE Brooklyn Ct
- 2965 SE 184th Place
- 18230 SE Brooklyn Ct
- 18227 SE Tibbetts Ct
- 2966 SE 184th Place
- 18409 SE Tibbetts Ct
- 18330 SE Brooklyn Ct
- 18247 SE Brooklyn Ct
- 18233 SE Brooklyn Ct
- 18326 SE Tibbetts Ct
- 2945 SE 184th Place
- 18310 SE Tibbetts Ct