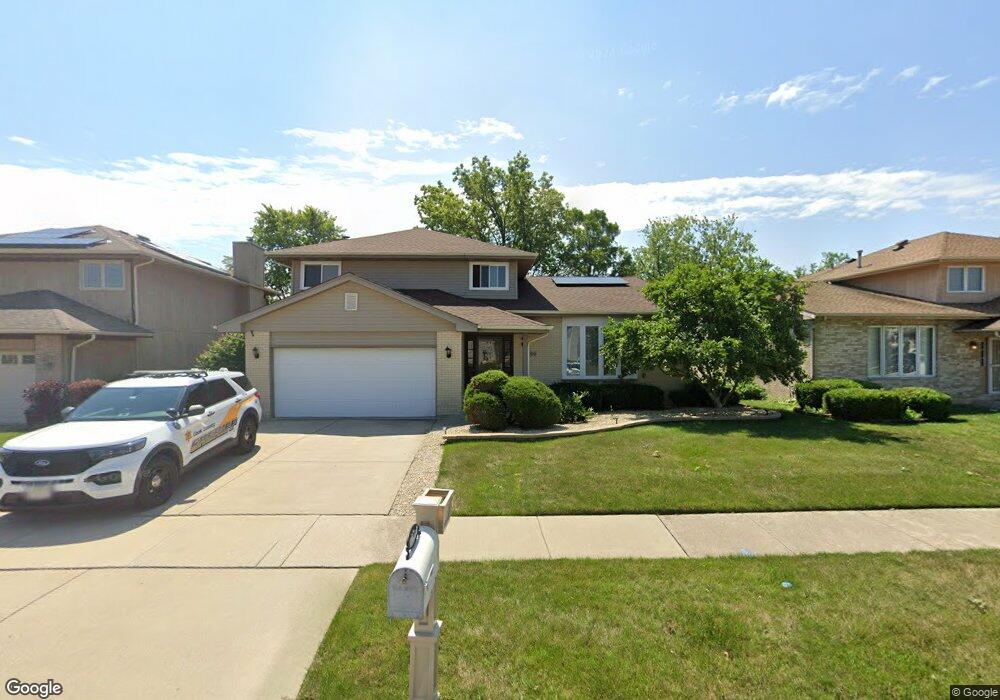
3009 Surrey Ln Hazel Crest, IL 60429
Stonebridge NeighborhoodEstimated Value: $244,000 - $372,000
3
Beds
3
Baths
2,563
Sq Ft
$117/Sq Ft
Est. Value
About This Home
This home is located at 3009 Surrey Ln, Hazel Crest, IL 60429 and is currently estimated at $300,021, approximately $117 per square foot. 3009 Surrey Ln is a home located in Cook County with nearby schools including Mae Jemison School, Prairie-Hills Junior High School, and Hillcrest High School.
Ownership History
Date
Name
Owned For
Owner Type
Purchase Details
Closed on
Nov 22, 2006
Sold by
Daniels Davis Tarra M
Bought by
Davis Mark I and Daniels Davis Tarra M
Current Estimated Value
Purchase Details
Closed on
Dec 11, 2003
Sold by
Midwest Partners
Bought by
Davis Tarra Daniels
Home Financials for this Owner
Home Financials are based on the most recent Mortgage that was taken out on this home.
Original Mortgage
$166,500
Interest Rate
5.91%
Mortgage Type
Unknown
Purchase Details
Closed on
Oct 12, 2000
Sold by
Orr David D
Bought by
Midwest Partners
Purchase Details
Closed on
Oct 11, 1994
Sold by
Beverly Trust Company
Bought by
Jones Raymond A and Jones Rhonda G
Home Financials for this Owner
Home Financials are based on the most recent Mortgage that was taken out on this home.
Original Mortgage
$131,300
Interest Rate
8.91%
Create a Home Valuation Report for This Property
The Home Valuation Report is an in-depth analysis detailing your home's value as well as a comparison with similar homes in the area
Home Values in the Area
Average Home Value in this Area
Purchase History
| Date | Buyer | Sale Price | Title Company |
|---|---|---|---|
| Davis Mark I | -- | Git | |
| Davis Tarra Daniels | -- | Law Title | |
| Midwest Partners | -- | -- | |
| Jones Raymond A | $164,500 | -- |
Source: Public Records
Mortgage History
| Date | Status | Borrower | Loan Amount |
|---|---|---|---|
| Previous Owner | Davis Tarra Daniels | $166,500 | |
| Previous Owner | Jones Raymond A | $131,300 |
Source: Public Records
Tax History
| Year | Tax Paid | Tax Assessment Tax Assessment Total Assessment is a certain percentage of the fair market value that is determined by local assessors to be the total taxable value of land and additions on the property. | Land | Improvement |
|---|---|---|---|---|
| 2025 | $12,646 | $28,000 | $3,264 | $24,736 |
| 2024 | $12,646 | $28,000 | $3,264 | $24,736 |
| 2023 | $7,455 | $28,000 | $3,264 | $24,736 |
| 2022 | $7,455 | $13,575 | $2,880 | $10,695 |
| 2021 | $7,249 | $13,575 | $2,880 | $10,695 |
| 2020 | $7,035 | $13,575 | $2,880 | $10,695 |
| 2019 | $9,216 | $17,193 | $2,688 | $14,505 |
| 2018 | $8,926 | $17,193 | $2,688 | $14,505 |
| 2017 | $8,376 | $17,193 | $2,688 | $14,505 |
| 2016 | $7,322 | $15,020 | $2,304 | $12,716 |
| 2015 | $6,943 | $15,020 | $2,304 | $12,716 |
| 2014 | $6,802 | $15,020 | $2,304 | $12,716 |
| 2013 | $6,923 | $17,085 | $2,304 | $14,781 |
Source: Public Records
Map
Nearby Homes
- 5 E Carriageway Dr Unit 201
- 5 E Carriageway Dr Unit 210
- 7 E Carriageway Dr Unit 311
- 17622 Oakwood Dr
- 2908 Buttonwood Walk
- 17804 Pebblewood Ln
- 17613 Grandview Dr
- 17714 Dogwood Ln
- 17405 Longfellow Ave
- 17910 Millstone Rd
- 17417 Kedzie Ave
- 17803 Dogwood Ln
- 2912 175th St
- 17805 Dogwood Ln
- 3107 Longfellow Ave
- 17410 Emerson Ave
- 2900 175th St
- 2722 Cherrywood Place
- 3068 Hickory Rd
- 3100 Longfellow Ave
- 3007 Surrey Ln
- 3011 Surrey Ln
- 17710 Stonebridge Dr
- 3005 Surrey Ln
- 17712 Stonebridge Dr
- 3013 Surrey Ln
- 17708 Stonebridge Dr
- 17615 Balmoral Ln
- 17714 Stonebridge Dr
- 3003 Surrey Ln
- 3101 Surrey Ln
- 17706 Stonebridge Dr
- 3100 Oakwood Dr
- 17613 Balmoral Ln
- 3102 Oakwood Dr
- 17612 Surrey Ln
- 3103 Surrey Ln
- 17704 Stonebridge Dr
- 3001 Surrey Ln
- 3104 Oakwood Dr
Your Personal Tour Guide
Ask me questions while you tour the home.