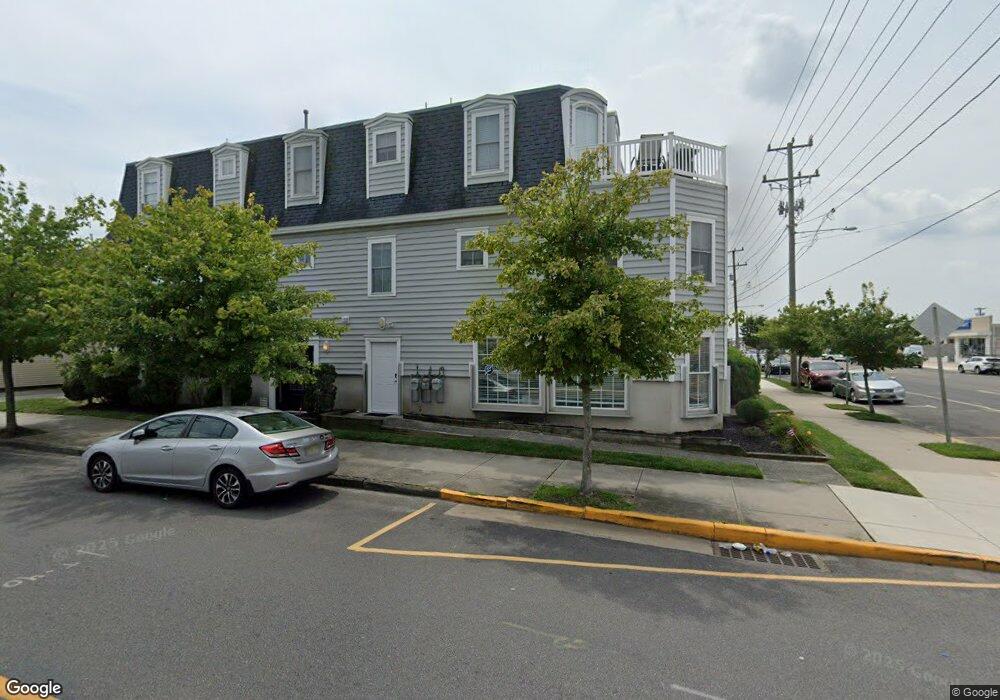
300A E 12th St Unit B Ocean City, NJ 08226
Estimated Value: $381,000 - $936,000
--
Bed
--
Bath
1,146
Sq Ft
$513/Sq Ft
Est. Value
About This Home
This home is located at 300A E 12th St Unit B, Ocean City, NJ 08226 and is currently estimated at $587,839, approximately $512 per square foot. 300A E 12th St Unit B is a home located in Cape May County with nearby schools including Ocean City Primary School, Ocean City Intermediate School, and Ocean City High School.
Ownership History
Date
Name
Owned For
Owner Type
Purchase Details
Closed on
Mar 6, 2023
Sold by
Nguyen Tieng
Bought by
Duncan Real Estate Investments Llc and Sj Linens Holdings Llc
Current Estimated Value
Purchase Details
Closed on
Apr 18, 2014
Sold by
Feinstein Kurt
Bought by
Nguyen Tieng and Nguyen Christine
Home Financials for this Owner
Home Financials are based on the most recent Mortgage that was taken out on this home.
Original Mortgage
$150,000
Interest Rate
4.27%
Mortgage Type
Purchase Money Mortgage
Purchase Details
Closed on
Feb 28, 2005
Sold by
Sea Breeze Development Llc
Bought by
Canavan Donna L
Home Financials for this Owner
Home Financials are based on the most recent Mortgage that was taken out on this home.
Original Mortgage
$383,200
Interest Rate
6.87%
Mortgage Type
Purchase Money Mortgage
Purchase Details
Closed on
Apr 2, 2004
Sold by
Sea Breeze Development Llc
Bought by
Feinstein Kurt
Create a Home Valuation Report for This Property
The Home Valuation Report is an in-depth analysis detailing your home's value as well as a comparison with similar homes in the area
Home Values in the Area
Average Home Value in this Area
Purchase History
| Date | Buyer | Sale Price | Title Company |
|---|---|---|---|
| Duncan Real Estate Investments Llc | $282,000 | The Title Company | |
| Duncan Real Estate Inv Llc | $282,000 | The Title Company | |
| Nguyen Tieng | $200,000 | North American Title Agency | |
| Canavan Donna L | $479,000 | -- | |
| Feinstein Kurt | $75,000 | -- | |
| Feinstein Kurt | $75,000 | Mutual Title Agency |
Source: Public Records
Mortgage History
| Date | Status | Borrower | Loan Amount |
|---|---|---|---|
| Previous Owner | Nguyen Tieng | $150,000 | |
| Previous Owner | Canavan Donna L | $383,200 |
Source: Public Records
Tax History Compared to Growth
Tax History
| Year | Tax Paid | Tax Assessment Tax Assessment Total Assessment is a certain percentage of the fair market value that is determined by local assessors to be the total taxable value of land and additions on the property. | Land | Improvement |
|---|---|---|---|---|
| 2025 | $1,089 | $97,100 | $38,400 | $58,700 |
| 2024 | $1,089 | $97,100 | $38,400 | $58,700 |
| 2023 | $1,040 | $97,100 | $38,400 | $58,700 |
| 2022 | $999 | $97,100 | $38,400 | $58,700 |
| 2021 | $976 | $97,100 | $38,400 | $58,700 |
| 2020 | $950 | $97,100 | $38,400 | $58,700 |
| 2019 | $939 | $97,100 | $38,400 | $58,700 |
| 2018 | $930 | $97,100 | $38,400 | $58,700 |
| 2017 | $916 | $97,100 | $38,400 | $58,700 |
| 2016 | $881 | $97,100 | $38,400 | $58,700 |
| 2015 | $869 | $97,100 | $38,400 | $58,700 |
| 2014 | $856 | $97,100 | $38,400 | $58,700 |
Source: Public Records
Map
Nearby Homes
- 1123 Asbury Ave Unit C
- 1129 West Ave Unit 1
- 1117 West Ave Unit 2
- 1115 West Ave Unit 1
- 1107 West Ave
- 412 E 11th St Unit 2
- 1061 Asbury Ave
- 1113 Simpson Ave
- 1130 Simpson Ave Unit 1
- 1219 Wesley Ave Unit B
- 1357 Asbury Ave Unit B
- 1329 Central Ave Unit 1
- 10 E 11th St Unit 2
- 1116 Ocean Ave Unit C
- 1116 Ocean Ave Unit B
- 1416 Asbury Ave Unit 1
- 1415 West Ave Unit 2nd floor
- 1359 Tioga Terrace
- 1312 Ocean Ave Unit 1
- 1229 Pleasure Ave Unit 1
- 300A E 12th St Unit B
- 300A E 12th St Unit B
- 300 E 12th St
- 1205 West Ave Unit B
- 1205 West Ave Unit 3
- 1205 West Ave
- 1205 West Ave Unit C
- 1209 West Ave
- 1212 Asbury Ave Unit Top Floor
- 1212 Asbury Ave Unit A
- 1212 Asbury Ave Unit 3
- 1213 West Ave Unit 2nd Floor
- 1213 West Ave Unit 3rd Floor
- 1213 West Ave Unit C
- 1213 West Ave Unit A
- 1213 West Ave
- 1161 West Ave Unit C - Top Floor
- 1161 West Ave
- 1161 West Ave Unit A
- 1161 West Ave Unit B