Estimated Value: $271,992 - $330,000
3
Beds
3
Baths
1,196
Sq Ft
$253/Sq Ft
Est. Value
About This Home
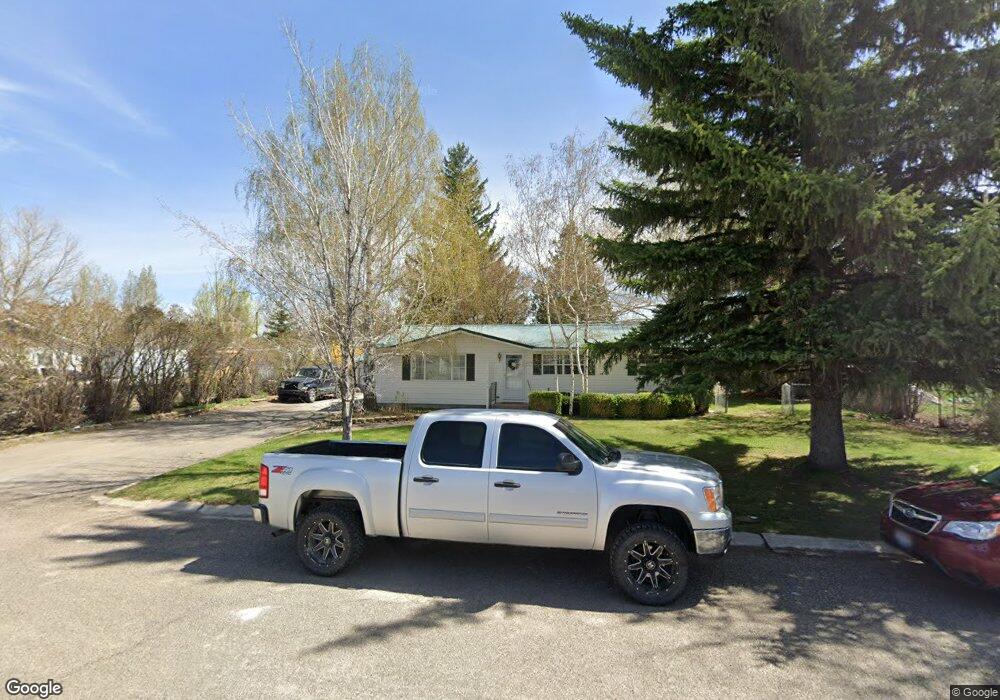
This home is located at 301 1st St W, Declo, ID 83323 and is currently estimated at $302,998, approximately $253 per square foot. 301 1st St W is a home with nearby schools including Declo Elementary School, Declo Junior High School, and Declo Senior High School.
Ownership History
Date
Name
Owned For
Owner Type
Purchase Details
Closed on
Sep 26, 2023
Sold by
Martindale Richard W
Bought by
Leach Alex and Leach Georgia
Current Estimated Value
Home Financials for this Owner
Home Financials are based on the most recent Mortgage that was taken out on this home.
Original Mortgage
$245,471
Outstanding Balance
$239,735
Interest Rate
7.12%
Mortgage Type
FHA
Estimated Equity
$63,263
Purchase Details
Closed on
Sep 22, 2015
Sold by
Cristensen Don H
Bought by
Estate Of Sandra Christensen
Create a Home Valuation Report for This Property
The Home Valuation Report is an in-depth analysis detailing your home's value as well as a comparison with similar homes in the area
Purchase History
| Date | Buyer | Sale Price | Title Company |
|---|---|---|---|
| Leach Alex | -- | None Listed On Document | |
| Estate Of Sandra Christensen | -- | None Available |
Source: Public Records
Mortgage History
| Date | Status | Borrower | Loan Amount |
|---|---|---|---|
| Open | Leach Alex | $245,471 |
Source: Public Records
Tax History
| Year | Tax Paid | Tax Assessment Tax Assessment Total Assessment is a certain percentage of the fair market value that is determined by local assessors to be the total taxable value of land and additions on the property. | Land | Improvement |
|---|---|---|---|---|
| 2024 | $544 | $178,310 | $47,840 | $130,470 |
| 2023 | $206 | $200,624 | $47,840 | $152,784 |
| 2022 | $171 | $163,518 | $34,040 | $129,478 |
| 2021 | $168 | $131,287 | $25,515 | $105,772 |
| 2020 | $184 | $88,720 | $9,735 | $78,985 |
| 2019 | $562 | $85,870 | $9,184 | $76,686 |
| 2017 | $68 | $75,825 | $8,349 | $67,476 |
| 2016 | $44 | $73,349 | $8,349 | $65,000 |
| 2015 | $44 | $72,590 | $7,590 | $65,000 |
| 2014 | $44 | $72,590 | $7,590 | $65,000 |
| 2013 | $44 | $72,590 | $7,590 | $65,000 |
Source: Public Records
Map
Nearby Homes
Your Personal Tour Guide
Ask me questions while you tour the home.