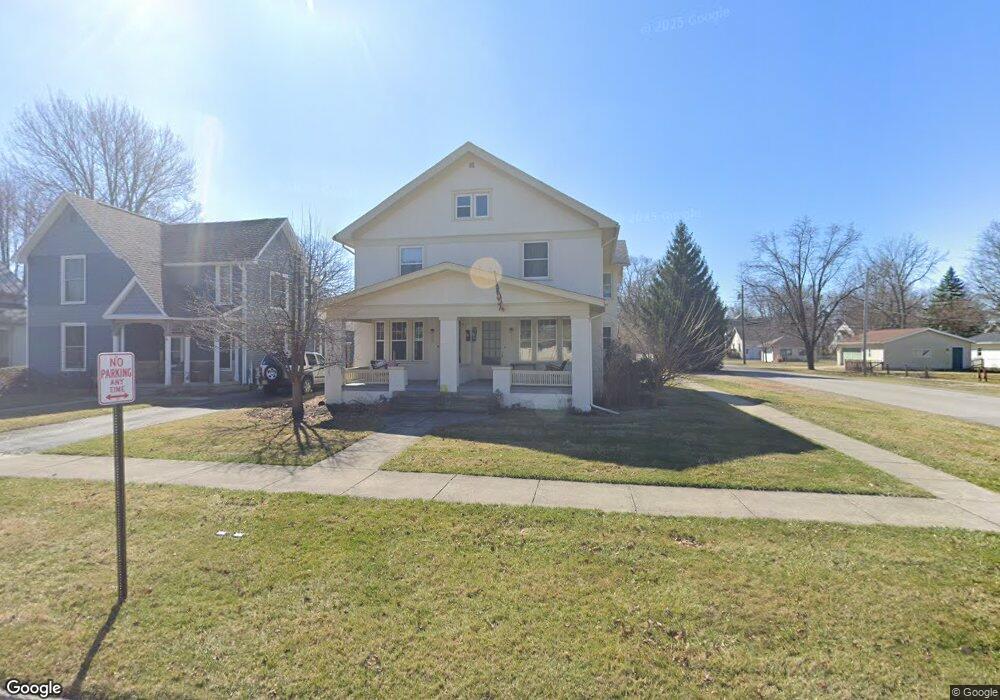
301 2nd St Findlay, OH 45840
Estimated Value: $194,000 - $245,274
3
Beds
3
Baths
3,981
Sq Ft
$55/Sq Ft
Est. Value
About This Home
This home is located at 301 2nd St, Findlay, OH 45840 and is currently estimated at $220,819, approximately $55 per square foot. 301 2nd St is a home located in Hancock County with nearby schools including Jefferson Elementary School, Chamberlin Hill Elementary School, and Donnell Middle School.
Ownership History
Date
Name
Owned For
Owner Type
Purchase Details
Closed on
Nov 2, 2010
Sold by
Thomas John L
Bought by
Shaull Scott B
Current Estimated Value
Home Financials for this Owner
Home Financials are based on the most recent Mortgage that was taken out on this home.
Original Mortgage
$76,000
Outstanding Balance
$50,399
Interest Rate
4.37%
Mortgage Type
New Conventional
Estimated Equity
$170,420
Purchase Details
Closed on
Jul 1, 1986
Bought by
Thomas James L
Purchase Details
Closed on
Jun 20, 1984
Bought by
Day Gladys R
Purchase Details
Closed on
May 12, 1983
Bought by
Day Day R and Day Gladys R
Create a Home Valuation Report for This Property
The Home Valuation Report is an in-depth analysis detailing your home's value as well as a comparison with similar homes in the area
Home Values in the Area
Average Home Value in this Area
Purchase History
| Date | Buyer | Sale Price | Title Company |
|---|---|---|---|
| Shaull Scott B | $95,000 | Assured Title Agency | |
| Thomas James L | $53,000 | -- | |
| Day Gladys R | -- | -- | |
| Day Day R | -- | -- |
Source: Public Records
Mortgage History
| Date | Status | Borrower | Loan Amount |
|---|---|---|---|
| Open | Shaull Scott B | $76,000 |
Source: Public Records
Tax History Compared to Growth
Tax History
| Year | Tax Paid | Tax Assessment Tax Assessment Total Assessment is a certain percentage of the fair market value that is determined by local assessors to be the total taxable value of land and additions on the property. | Land | Improvement |
|---|---|---|---|---|
| 2024 | $2,309 | $63,350 | $6,930 | $56,420 |
| 2023 | $2,313 | $63,350 | $6,930 | $56,420 |
| 2022 | $2,305 | $63,350 | $6,930 | $56,420 |
| 2021 | $1,999 | $47,860 | $6,910 | $40,950 |
| 2020 | $1,999 | $47,860 | $6,910 | $40,950 |
| 2019 | $1,960 | $47,860 | $6,910 | $40,950 |
| 2018 | $1,717 | $38,430 | $5,530 | $32,900 |
| 2017 | $1,716 | $38,430 | $5,530 | $32,900 |
| 2016 | $1,697 | $38,430 | $5,530 | $32,900 |
| 2015 | $1,544 | $34,330 | $5,530 | $28,800 |
| 2014 | $1,544 | $34,330 | $5,530 | $28,800 |
| 2012 | $2,051 | $45,250 | $5,530 | $39,720 |
Source: Public Records
Map
Nearby Homes