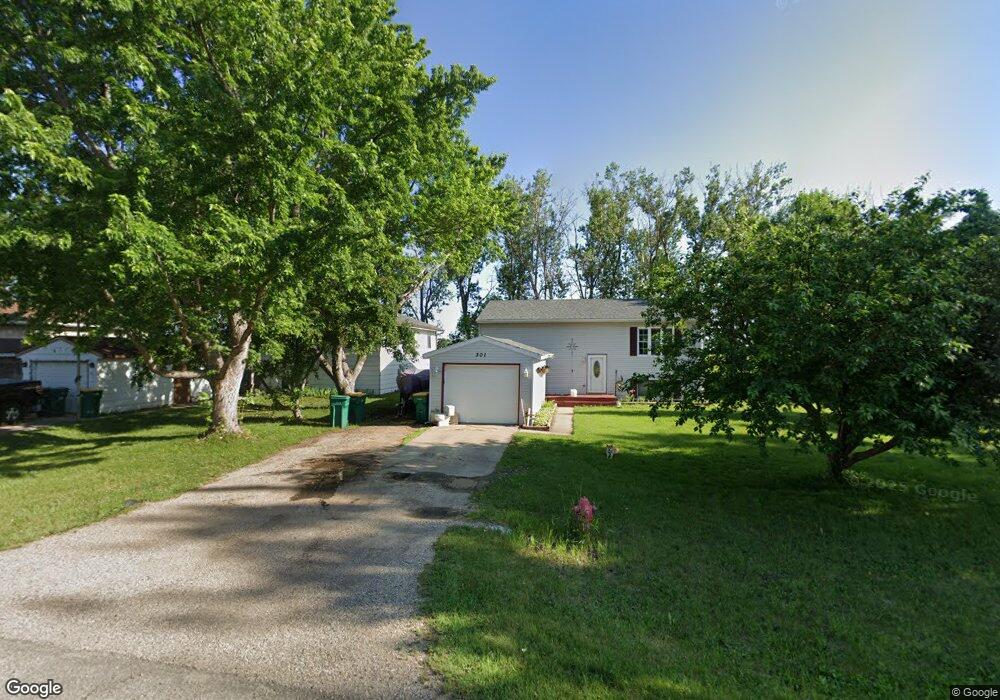
301 5th St Mapleton, ND 58059
Estimated Value: $253,000 - $263,388
4
Beds
2
Baths
1,824
Sq Ft
$142/Sq Ft
Est. Value
About This Home
This home is located at 301 5th St, Mapleton, ND 58059 and is currently estimated at $259,347, approximately $142 per square foot. 301 5th St is a home located in Cass County with nearby schools including Mapleton Elementary School.
Ownership History
Date
Name
Owned For
Owner Type
Purchase Details
Closed on
Jun 25, 2019
Sold by
Therrian Travis H and Therrian Emily S
Bought by
Jaskierny Jessica and Jacobson Christopher
Current Estimated Value
Home Financials for this Owner
Home Financials are based on the most recent Mortgage that was taken out on this home.
Original Mortgage
$166,920
Outstanding Balance
$146,774
Interest Rate
4%
Mortgage Type
FHA
Estimated Equity
$112,573
Purchase Details
Closed on
Dec 9, 2016
Sold by
Kohler Tiffany J and Kohler Justin K
Bought by
Therrian Travis H and Therrian Emily S
Home Financials for this Owner
Home Financials are based on the most recent Mortgage that was taken out on this home.
Original Mortgage
$151,050
Interest Rate
3.47%
Mortgage Type
New Conventional
Purchase Details
Closed on
May 15, 2013
Sold by
Turnquist Denise L and Turnquist Justin R
Bought by
January Tiffany J and Kohler Justin R
Home Financials for this Owner
Home Financials are based on the most recent Mortgage that was taken out on this home.
Original Mortgage
$117,244
Interest Rate
3.52%
Mortgage Type
New Conventional
Purchase Details
Closed on
Mar 15, 2006
Sold by
Dick Mark and Dick Lisa
Bought by
Turnquist Denise L and Turnquist Justin R
Home Financials for this Owner
Home Financials are based on the most recent Mortgage that was taken out on this home.
Original Mortgage
$79,920
Interest Rate
7.8%
Mortgage Type
Adjustable Rate Mortgage/ARM
Create a Home Valuation Report for This Property
The Home Valuation Report is an in-depth analysis detailing your home's value as well as a comparison with similar homes in the area
Purchase History
| Date | Buyer | Sale Price | Title Company |
|---|---|---|---|
| Jaskierny Jessica | $170,000 | Fm Title | |
| Therrian Travis H | $159,000 | Title Co | |
| January Tiffany J | $114,900 | Title Co | |
| Turnquist Denise L | -- | -- |
Source: Public Records
Mortgage History
| Date | Status | Borrower | Loan Amount |
|---|---|---|---|
| Open | Jaskierny Jessica | $166,920 | |
| Previous Owner | Therrian Travis H | $151,050 | |
| Previous Owner | January Tiffany J | $117,244 | |
| Previous Owner | Turnquist Denise L | $79,920 |
Source: Public Records
Tax History
| Year | Tax Paid | Tax Assessment Tax Assessment Total Assessment is a certain percentage of the fair market value that is determined by local assessors to be the total taxable value of land and additions on the property. | Land | Improvement |
|---|---|---|---|---|
| 2024 | $3,311 | $106,050 | $18,950 | $87,100 |
| 2023 | $3,275 | $106,750 | $18,950 | $87,800 |
| 2022 | $2,853 | $98,100 | $18,950 | $79,150 |
| 2021 | $2,688 | $88,550 | $14,650 | $73,900 |
| 2020 | $2,574 | $86,200 | $14,650 | $71,550 |
| 2019 | $2,574 | $86,200 | $14,650 | $71,550 |
| 2018 | $2,601 | $86,200 | $14,650 | $71,550 |
| 2017 | $2,438 | $85,400 | $14,650 | $70,750 |
| 2016 | $1,435 | $69,400 | $7,150 | $62,250 |
| 2015 | $1,271 | $64,250 | $6,600 | $57,650 |
| 2014 | $1,240 | $58,400 | $6,000 | $52,400 |
| 2013 | $1,364 | $58,400 | $6,000 | $52,400 |
Source: Public Records
Map
Nearby Homes
Your Personal Tour Guide
Ask me questions while you tour the home.