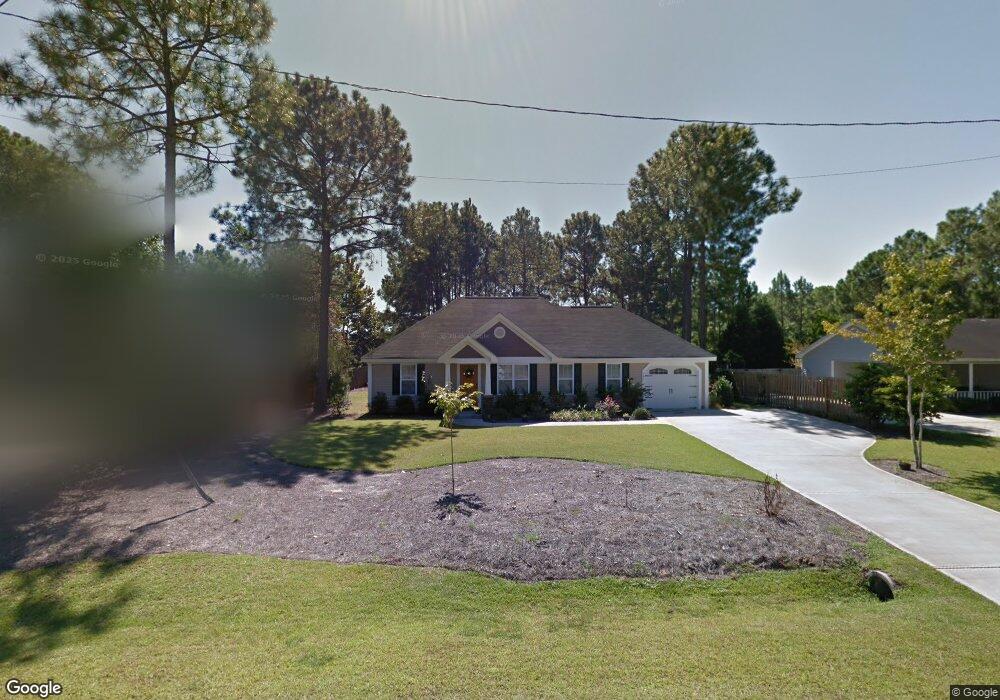
301 Albemarle Rd Wilmington, NC 28405
Estimated Value: $356,538 - $410,000
3
Beds
2
Baths
1,480
Sq Ft
$261/Sq Ft
Est. Value
About This Home
This home is located at 301 Albemarle Rd, Wilmington, NC 28405 and is currently estimated at $385,635, approximately $260 per square foot. 301 Albemarle Rd is a home located in New Hanover County with nearby schools including John J. Blair Elementary School, Emma B. Trask Middle School, and New Hanover High School.
Ownership History
Date
Name
Owned For
Owner Type
Purchase Details
Closed on
Oct 31, 2011
Sold by
Sanco Builders Corp
Bought by
Labriola Robin F
Current Estimated Value
Home Financials for this Owner
Home Financials are based on the most recent Mortgage that was taken out on this home.
Original Mortgage
$129,000
Outstanding Balance
$88,237
Interest Rate
4.16%
Mortgage Type
New Conventional
Estimated Equity
$297,398
Purchase Details
Closed on
Apr 15, 2011
Sold by
Smith Carson Henry
Bought by
Sanco Builders
Purchase Details
Closed on
Mar 4, 2004
Sold by
Mammay Patricia
Bought by
King Sharon Lea
Purchase Details
Closed on
Aug 13, 2001
Sold by
Landmark Organization Inc
Bought by
Mammay Patricia S
Purchase Details
Closed on
Feb 10, 1989
Sold by
Norris Builders Inc
Bought by
Landmark Organization Inc
Purchase Details
Closed on
Apr 1, 1986
Sold by
Landmark Organization Inc
Bought by
Norris Builders Inc
Create a Home Valuation Report for This Property
The Home Valuation Report is an in-depth analysis detailing your home's value as well as a comparison with similar homes in the area
Home Values in the Area
Average Home Value in this Area
Purchase History
| Date | Buyer | Sale Price | Title Company |
|---|---|---|---|
| Labriola Robin F | $165,000 | None Available | |
| Sanco Builders | $29,500 | None Available | |
| King Sharon Lea | -- | -- | |
| Mammay Patricia S | $16,000 | -- | |
| Landmark Organization Inc | -- | -- | |
| Norris Builders Inc | $207,000 | -- | |
| Landmark Organization Inc | -- | -- |
Source: Public Records
Mortgage History
| Date | Status | Borrower | Loan Amount |
|---|---|---|---|
| Open | Labriola Robin F | $129,000 |
Source: Public Records
Tax History Compared to Growth
Tax History
| Year | Tax Paid | Tax Assessment Tax Assessment Total Assessment is a certain percentage of the fair market value that is determined by local assessors to be the total taxable value of land and additions on the property. | Land | Improvement |
|---|---|---|---|---|
| 2025 | $1,252 | $382,800 | $124,600 | $258,200 |
| 2023 | $1,252 | $225,600 | $70,200 | $155,400 |
| 2022 | $1,258 | $225,600 | $70,200 | $155,400 |
| 2021 | $1,247 | $225,600 | $70,200 | $155,400 |
| 2020 | $985 | $155,700 | $41,400 | $114,300 |
| 2019 | $985 | $155,700 | $41,400 | $114,300 |
| 2018 | $985 | $155,700 | $41,400 | $114,300 |
| 2017 | $1,008 | $155,700 | $41,400 | $114,300 |
| 2016 | $970 | $140,000 | $41,400 | $98,600 |
| 2015 | $902 | $140,000 | $41,400 | $98,600 |
| 2014 | $449 | $71,000 | $41,400 | $29,600 |
Source: Public Records
Map
Nearby Homes
- 511 Albemarle Ct
- 518 Albemarle Ct
- 606 Fitzgerald Dr
- 102 Albemarle Rd
- 733 Bracken Fern Dr
- 5912 Chester St
- 1009 Fitzgerald Dr
- 5932 Chester St
- 4922 Shelley Dr
- 722 N College Rd
- 6012 Inland Greens Dr
- 311 N Cardinal Extension Dr
- 5202 Fitzgerald Dr
- 508 N Green Meadows Dr
- 635 N College Rd
- 323 Wiregrass Rd
- 211 Birdie Ln
- 601 High Bush Ct
- 6128 Inland Greens Dr
- 1314 Carlyle Ln
- 231 Albemarle Rd
- 303 Albemarle Rd
- 307 Albemarle Rd
- 227 Albemarle Rd
- 454 Day Lilly Dr
- 304 Albemarle Rd
- 311 Albemarle Rd
- 453 Day Lilly Dr
- 225 Albemarle Rd
- 308 Albemarle Rd
- 315 Albemarle Rd
- 451 Day Lilly Dr
- 312 Albemarle Rd
- 221 Albemarle Rd
- 305 Touch Me Not Dr
- 319 Albemarle Rd
- 319 Albemarle Rd
- 450 Day Lilly Dr
- 460 N Crestwood Dr
- 309 Touch Me Not Dr