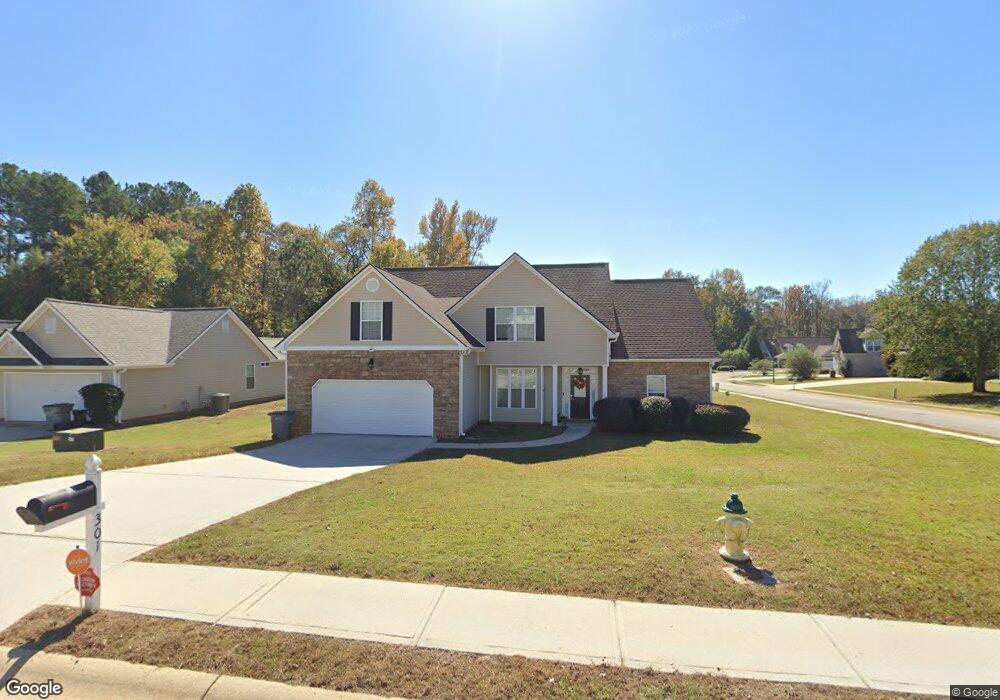
301 Baldwin Park Dr Lagrange, GA 30241
Estimated Value: $283,432 - $320,000
5
Beds
3
Baths
2,250
Sq Ft
$135/Sq Ft
Est. Value
About This Home
This home is located at 301 Baldwin Park Dr, Lagrange, GA 30241 and is currently estimated at $303,858, approximately $135 per square foot. 301 Baldwin Park Dr is a home located in Troup County with nearby schools including Whitesville Road Elementary School, Berta Weathersbee Elementary School, and Rosemont Elementary School.
Ownership History
Date
Name
Owned For
Owner Type
Purchase Details
Closed on
May 7, 2018
Sold by
Jennings George L
Bought by
Jones Tishanna Brenae Jackson and Jones Demetrius Lee
Current Estimated Value
Home Financials for this Owner
Home Financials are based on the most recent Mortgage that was taken out on this home.
Original Mortgage
$183,612
Outstanding Balance
$157,304
Interest Rate
4.37%
Mortgage Type
FHA
Estimated Equity
$146,555
Purchase Details
Closed on
Jan 25, 2017
Bought by
Jennings George L and Jennings Janna L
Home Financials for this Owner
Home Financials are based on the most recent Mortgage that was taken out on this home.
Original Mortgage
$141,000
Interest Rate
4.32%
Mortgage Type
New Conventional
Purchase Details
Closed on
Aug 14, 2006
Sold by
Neely Homes Inc
Bought by
Continental Development Inc
Purchase Details
Closed on
Feb 11, 2003
Sold by
Larry Ssg and Larry Lynn
Bought by
Neely Homes Inc
Create a Home Valuation Report for This Property
The Home Valuation Report is an in-depth analysis detailing your home's value as well as a comparison with similar homes in the area
Purchase History
| Date | Buyer | Sale Price | Title Company |
|---|---|---|---|
| Jones Tishanna Brenae Jackson | $187,000 | -- | |
| Jennings George L | -- | -- | |
| Continental Development Inc | $176,096 | -- | |
| Neely Homes Inc | $587,600 | -- |
Source: Public Records
Mortgage History
| Date | Status | Borrower | Loan Amount |
|---|---|---|---|
| Open | Jones Tishanna Brenae Jackson | $183,612 | |
| Previous Owner | Jennings George L | $141,000 |
Source: Public Records
Tax History
| Year | Tax Paid | Tax Assessment Tax Assessment Total Assessment is a certain percentage of the fair market value that is determined by local assessors to be the total taxable value of land and additions on the property. | Land | Improvement |
|---|---|---|---|---|
| 2025 | $2,939 | $114,800 | $18,000 | $96,800 |
| 2024 | $2,688 | $100,560 | $18,000 | $82,560 |
| 2023 | $2,172 | $81,640 | $14,000 | $67,640 |
| 2022 | $2,101 | $77,280 | $14,000 | $63,280 |
| 2021 | $2,274 | $77,400 | $10,000 | $67,400 |
| 2020 | $2,090 | $71,280 | $10,000 | $61,280 |
| 2019 | $2,027 | $69,200 | $10,000 | $59,200 |
| 2018 | $1,937 | $64,240 | $10,000 | $54,240 |
| 2017 | $1,906 | $63,200 | $4,800 | $58,400 |
| 2016 | $1,853 | $61,454 | $4,800 | $56,654 |
| 2015 | $1,857 | $61,454 | $4,800 | $56,654 |
| 2014 | $1,769 | $58,472 | $4,800 | $53,672 |
| 2013 | -- | $54,526 | $4,800 | $49,726 |
Source: Public Records
Map
Nearby Homes
- 111 Revere Ct
- 109 Nashua Dr
- 208 N Davis Rd
- 101 Beaver Creek Way
- 101 Beaver Creek Way Unit 246
- 103 Beaver Creek Way
- 103 Beaver Creek Way Unit 247
- 107 Beaver Creek Way Unit 249
- 107 Beaver Creek Way
- 102 Beaver Creek Way
- 102 Beaver Creek Way Unit 265
- 104 Beaver Creek Way
- 104 Beaver Creek Way Unit 264
- 436 Lakeview Way Unit 269
- 436 Lakeview Way
- 434 Lakeview Way
- 434 Lakeview Way Unit 270
- 430 Lakeview Way Unit 272
- 430 Lakeview Way
- 414 Lakeview Way
- 303 Baldwin Park Dr
- 209 Boston Dr
- 210 Boston Dr
- 305 Baldwin Park Dr
- 302 Baldwin Park Dr
- 212 Boston Dr
- 208 Boston Dr
- 102 Preakness Dr
- 207 Boston Dr Unit LOT 15
- 207 Boston Dr
- 300 Boston Dr
- 401 Baldwin Park Dr
- 206 Boston Dr
- 104 Preakness Dr
- 303 Boston Dr
- 114 Churchill Dr
- 302 Boston Dr
- 112 Churchill Dr
- 116 Churchill Dr
- 403 Baldwin Park Dr
Your Personal Tour Guide
Ask me questions while you tour the home.