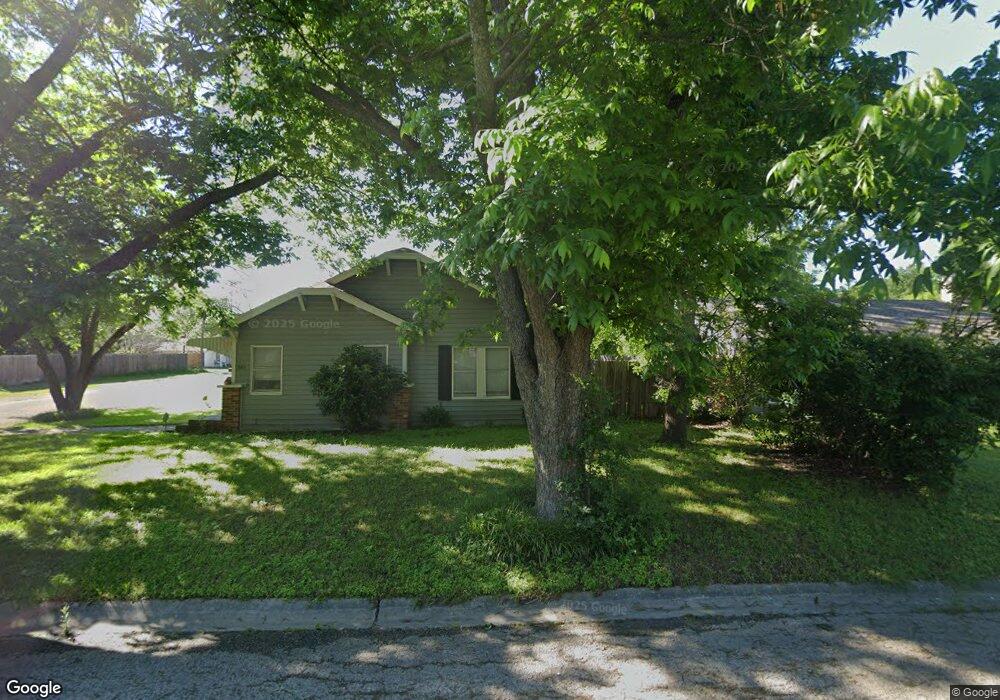
301 Bales St Cleburne, TX 76033
Estimated Value: $211,000 - $226,000
3
Beds
2
Baths
1,435
Sq Ft
$152/Sq Ft
Est. Value
About This Home
This home is located at 301 Bales St, Cleburne, TX 76033 and is currently estimated at $218,638, approximately $152 per square foot. 301 Bales St is a home located in Johnson County with nearby schools including Irving Elementary School, A.D. Wheat Middle School, and Cleburne High School.
Ownership History
Date
Name
Owned For
Owner Type
Purchase Details
Closed on
Nov 9, 2022
Sold by
Akers Jordan M
Bought by
Shelly Jordan M and Shelly James E
Current Estimated Value
Purchase Details
Closed on
Dec 14, 2018
Sold by
Bluemountain Texas Llc
Bought by
Akers Jordan M
Purchase Details
Closed on
Sep 29, 2017
Sold by
Tubbs William Lee
Bought by
Ska Properties Llc
Home Financials for this Owner
Home Financials are based on the most recent Mortgage that was taken out on this home.
Original Mortgage
$98,000
Interest Rate
3.89%
Mortgage Type
Commercial
Purchase Details
Closed on
Sep 28, 2017
Sold by
Ska Properties Llc
Bought by
Bluemountain Texas Llc
Home Financials for this Owner
Home Financials are based on the most recent Mortgage that was taken out on this home.
Original Mortgage
$98,000
Interest Rate
3.89%
Mortgage Type
Commercial
Purchase Details
Closed on
Jul 28, 2010
Sold by
Mcclure Juanita
Bought by
Kuklenski Mary Kay
Create a Home Valuation Report for This Property
The Home Valuation Report is an in-depth analysis detailing your home's value as well as a comparison with similar homes in the area
Home Values in the Area
Average Home Value in this Area
Purchase History
| Date | Buyer | Sale Price | Title Company |
|---|---|---|---|
| Shelly Jordan M | -- | -- | |
| Akers Jordan M | -- | None Available | |
| Ska Properties Llc | -- | None Available | |
| Bluemountain Texas Llc | -- | None Available | |
| Kuklenski Mary Kay | -- | Stnt |
Source: Public Records
Mortgage History
| Date | Status | Borrower | Loan Amount |
|---|---|---|---|
| Previous Owner | Bluemountain Texas Llc | $98,000 |
Source: Public Records
Tax History
| Year | Tax Paid | Tax Assessment Tax Assessment Total Assessment is a certain percentage of the fair market value that is determined by local assessors to be the total taxable value of land and additions on the property. | Land | Improvement |
|---|---|---|---|---|
| 2025 | $2,668 | $190,857 | $28,000 | $162,857 |
| 2024 | $4,256 | $190,857 | $28,000 | $162,857 |
| 2023 | $2,676 | $190,857 | $28,000 | $162,857 |
| 2022 | $4,340 | $173,430 | $28,000 | $145,430 |
| 2021 | $4,525 | $173,430 | $28,000 | $145,430 |
| 2020 | $3,752 | $135,398 | $20,000 | $115,398 |
| 2019 | $4,001 | $135,398 | $20,000 | $115,398 |
| 2018 | $1,598 | $54,053 | $13,000 | $41,053 |
| 2017 | $1,591 | $54,053 | $13,000 | $41,053 |
| 2016 | $938 | $31,876 | $11,500 | $20,376 |
Source: Public Records
Map
Nearby Homes
- 308 Poindexter Ave
- 411 Euclid St
- 918 N Main St
- 604 Poindexter Ave
- 607 N Wood St
- 418 Marengo St
- 103 Myers Ave
- 1019 N Anglin St
- 502 Bales St
- 701 Poindexter Ave
- 1313 N Robinson St
- 910 Baird St
- 807 Poindexter Ave
- 603 Madison St
- 212 Preston Dr
- 110 Ramsey Ave
- 221 Rose Ave
- 107 Woodard Ave
- 315 Rose Ave
- 741 N Robinson St
- 303 Bales St
- 215 Bales St
- 307 Bales St
- 1204 N Buffalo Ave
- 302 Poindexter Ave
- 302 Bales St
- 309 Bales St
- 304 Poindexter Ave
- 211 Bales St
- 306 Bales St
- 218 Poindexter Ave
- 306 Poindexter Ave
- 214 Poindexter Ave
- 311 Bales St
- 209 Bales St
- 216 Bales St
- 212 Bales St
- 310 Bales St
- 207 Bales St
- 310 Poindexter Ave