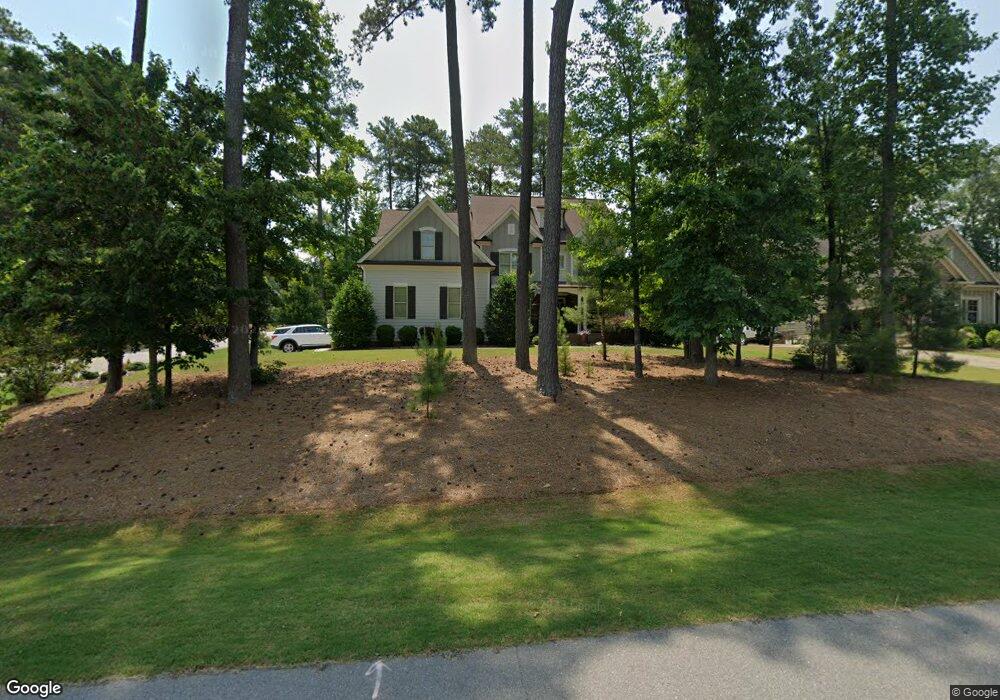
301 Bishop Falls Rd Unit Lot67 Wake Forest, NC 27587
Falls Lake NeighborhoodEstimated Value: $924,000 - $1,126,000
5
Beds
6
Baths
4,868
Sq Ft
$220/Sq Ft
Est. Value
About This Home
This home is located at 301 Bishop Falls Rd Unit Lot67, Wake Forest, NC 27587 and is currently estimated at $1,070,411, approximately $219 per square foot. 301 Bishop Falls Rd Unit Lot67 is a home located in Wake County with nearby schools including Forest Pines Drive Elementary School, Wake Forest-Rolesville Middle School, and Wake Forest High School.
Ownership History
Date
Name
Owned For
Owner Type
Purchase Details
Closed on
Apr 7, 2014
Sold by
Homestead Building Co
Bought by
Carter James J and Carter Suzanne M
Current Estimated Value
Home Financials for this Owner
Home Financials are based on the most recent Mortgage that was taken out on this home.
Original Mortgage
$175,000
Outstanding Balance
$123,235
Interest Rate
2.5%
Mortgage Type
Adjustable Rate Mortgage/ARM
Estimated Equity
$947,176
Purchase Details
Closed on
Feb 14, 2013
Sold by
Clear Stream Builders Llc
Bought by
Homestead Building Co
Home Financials for this Owner
Home Financials are based on the most recent Mortgage that was taken out on this home.
Original Mortgage
$71,067
Interest Rate
3.43%
Mortgage Type
Future Advance Clause Open End Mortgage
Purchase Details
Closed on
May 31, 2006
Sold by
St Ives Llc
Bought by
Clear Stream Builders Inc
Create a Home Valuation Report for This Property
The Home Valuation Report is an in-depth analysis detailing your home's value as well as a comparison with similar homes in the area
Home Values in the Area
Average Home Value in this Area
Purchase History
| Date | Buyer | Sale Price | Title Company |
|---|---|---|---|
| Carter James J | $550,000 | None Available | |
| Homestead Building Co | $90,000 | None Available | |
| Clear Stream Builders Inc | $328,000 | None Available |
Source: Public Records
Mortgage History
| Date | Status | Borrower | Loan Amount |
|---|---|---|---|
| Open | Carter James J | $175,000 | |
| Previous Owner | Homestead Building Co | $71,067 |
Source: Public Records
Tax History Compared to Growth
Tax History
| Year | Tax Paid | Tax Assessment Tax Assessment Total Assessment is a certain percentage of the fair market value that is determined by local assessors to be the total taxable value of land and additions on the property. | Land | Improvement |
|---|---|---|---|---|
| 2025 | $9,345 | $970,470 | $180,000 | $790,470 |
| 2024 | $9,200 | $970,470 | $180,000 | $790,470 |
| 2023 | $7,853 | $674,081 | $130,000 | $544,081 |
| 2022 | $7,533 | $674,081 | $130,000 | $544,081 |
| 2021 | $7,401 | $674,081 | $130,000 | $544,081 |
| 2020 | $7,401 | $674,081 | $130,000 | $544,081 |
| 2019 | $6,844 | $549,976 | $102,000 | $447,976 |
| 2018 | $6,479 | $549,976 | $102,000 | $447,976 |
| 2017 | $6,262 | $549,976 | $102,000 | $447,976 |
| 2016 | $6,182 | $549,976 | $102,000 | $447,976 |
| 2015 | $6,850 | $602,055 | $175,000 | $427,055 |
| 2014 | $6,631 | $602,055 | $175,000 | $427,055 |
Source: Public Records
Map
Nearby Homes
- 235 Capellan St
- 7328 Sparhawk Rd
- 2957 Wexford Pond Way
- 7932 Wexford Waters Ln
- 2808 Wexford Forest Ln
- 2928 Wexford Pond Way
- 8008 Wexford Waters Ln
- 2800 Wexford Forest Ln
- 7956 Wexford Waters Ln
- 7805 Ailesbury Rd
- 7312 Wexford Woods Ln
- 7961 Wexford Waters Ln
- 7813 Ailesbury Rd
- 2725 Trifle Ln
- 8000 Wexford Waters Ln
- 7317 Wexford Woods Ln
- 7636 Matherly Dr
- 321 Glencoe Dr Unit B
- 2508 Kearney Rd
- 2428 Rachel Dr
- 301 Bishop Falls Rd
- 305 Bishop Falls Rd
- 305 Bishop Falls Rd Unit 68
- 251 Bishop Falls Rd
- 251 Bishop Falls Rd Unit 78
- 300 Capellan St
- 309 Bishop Falls Rd
- 304 Capellan St
- 300 Bishop Falls Rd
- 300 Bishop Falls Rd Unit Lt 74
- 250 Capellan St
- 250 Capellan St Unit 79
- 304 Bishop Falls Rd
- 308 Capellan St
- 308 Capellan St Unit 64
- 247 Bishop Falls Rd
- 250 Bishop Falls Rd
- 250 Bishop Falls Rd Unit 75
- 246 Capellan St
- 308 Bishop Falls Rd