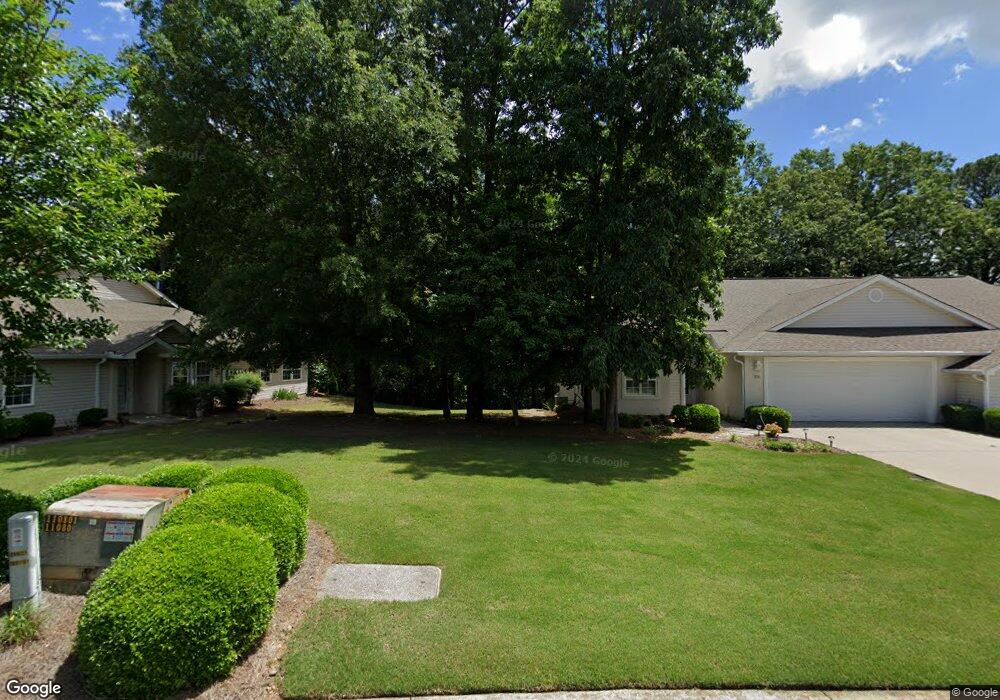
301 Bowen Place Dalton, GA 30720
Estimated Value: $204,000 - $225,000
2
Beds
2
Baths
1,248
Sq Ft
$172/Sq Ft
Est. Value
About This Home
This home is located at 301 Bowen Place, Dalton, GA 30720 and is currently estimated at $214,417, approximately $171 per square foot. 301 Bowen Place is a home located in Whitfield County with nearby schools including City Park Elementary School, Dalton Middle School, and Dalton High School.
Ownership History
Date
Name
Owned For
Owner Type
Purchase Details
Closed on
Jan 7, 2016
Sold by
Headrick Allen
Bought by
Green Zachary Lee and Green Randi Michelle
Current Estimated Value
Purchase Details
Closed on
Dec 18, 2014
Sold by
Sampson Daniel
Bought by
Headrick Allen
Purchase Details
Closed on
Dec 18, 2012
Sold by
Sampson Michael Shane
Bought by
Sampson Daniel
Purchase Details
Closed on
Jul 20, 2010
Sold by
Sampson Danny
Bought by
Sampson Michael Shane
Home Financials for this Owner
Home Financials are based on the most recent Mortgage that was taken out on this home.
Original Mortgage
$110,000
Interest Rate
4.7%
Mortgage Type
New Conventional
Purchase Details
Closed on
Aug 16, 2007
Sold by
Parsons Greg H
Bought by
Sampson Michael Shane
Purchase Details
Closed on
Nov 17, 2006
Sold by
Of Lucy Adams Talle
Bought by
Parsons Greg H
Purchase Details
Closed on
May 1, 1997
Bought by
Talley Lucy A
Create a Home Valuation Report for This Property
The Home Valuation Report is an in-depth analysis detailing your home's value as well as a comparison with similar homes in the area
Home Values in the Area
Average Home Value in this Area
Purchase History
| Date | Buyer | Sale Price | Title Company |
|---|---|---|---|
| Green Zachary Lee | $82,750 | -- | |
| Headrick Allen | $78,000 | -- | |
| Sampson Daniel | -- | -- | |
| Sampson Michael Shane | $66,643 | -- | |
| Sampson Michael Shane | $135,000 | -- | |
| Parsons Greg H | $120,000 | -- | |
| Talley Lucy A | $105,300 | -- |
Source: Public Records
Mortgage History
| Date | Status | Borrower | Loan Amount |
|---|---|---|---|
| Previous Owner | Sampson Michael Shane | $110,000 |
Source: Public Records
Tax History Compared to Growth
Tax History
| Year | Tax Paid | Tax Assessment Tax Assessment Total Assessment is a certain percentage of the fair market value that is determined by local assessors to be the total taxable value of land and additions on the property. | Land | Improvement |
|---|---|---|---|---|
| 2024 | $2,729 | $92,319 | $0 | $92,319 |
| 2023 | $2,229 | $72,121 | $0 | $72,121 |
| 2022 | $1,689 | $56,440 | $0 | $56,440 |
| 2021 | $1,692 | $56,440 | $0 | $56,440 |
| 2020 | $1,774 | $57,223 | $0 | $57,223 |
| 2019 | $1,825 | $57,223 | $0 | $57,223 |
| 2018 | $1,678 | $52,716 | $10,500 | $42,216 |
| 2017 | $901 | $52,716 | $10,500 | $42,216 |
| 2016 | $1,776 | $48,896 | $10,500 | $38,396 |
| 2014 | $1,220 | $43,888 | $10,500 | $33,388 |
| 2013 | -- | $43,888 | $10,500 | $33,388 |
Source: Public Records
Map
Nearby Homes
- 300 Bowen Place
- 303 Bowen Place
- 819 School St
- 305 Bowen Place
- 811 School St
- 302 Bowen Place
- 818 Vernon Ave
- 307 Bowen Place
- 304 Bowen Place
- 306 Bowen Place
- 309 Bowen Place
- 820 Vernon Ave
- 816 Vernon Ave
- 311 Bowen Place
- 299 N Boundary St
- 301 N Boundary St
- 303 N Boundary St
- 305 N Boundary St
- 803 School St
- 812 Vernon Ave