NOT LISTED FOR SALE

301 Bradley St Unit A111 Carrollton, GA 30117

Estimated Value: $274,556 - $303,000

2 Beds
1 Bath
1,159 Sq Ft
$249/Sq Ft Est. Value

Last Sold January 31, 2024

Last sale price $277,900 $240 Per Sq Ft

Est. 4% increase in value since last sale

Current estimated payment $1,726/month

About This Home

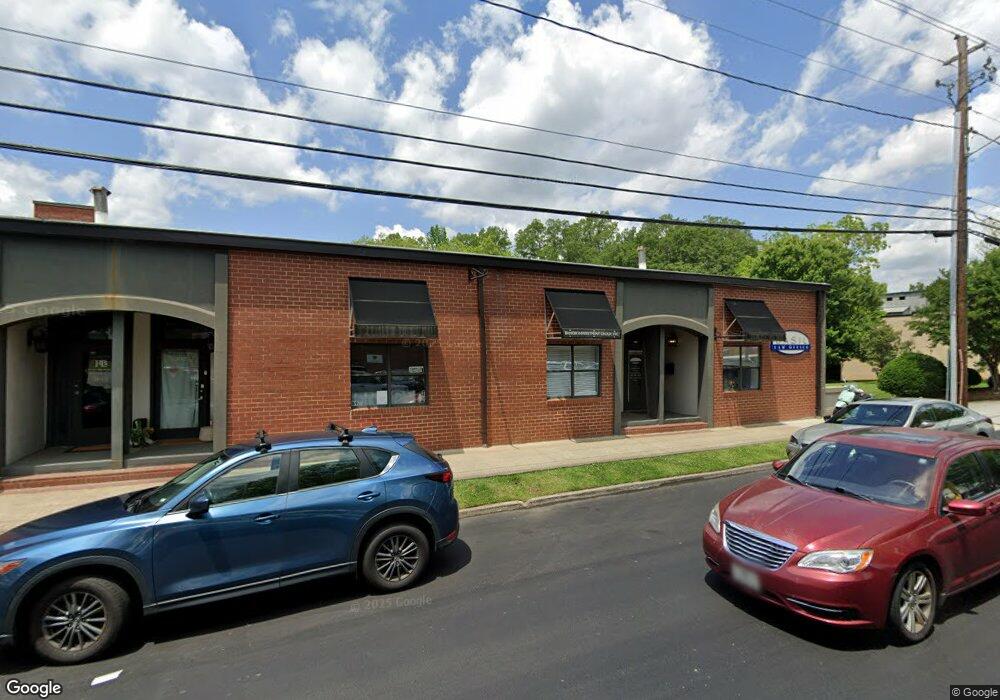
Imagine living in the bustling heart of the city, with easy access to shops, restaurants, and entertainment. This stunning loft offers 2 bedrooms and 1 bathroom, perfect for a Family or single professional. Don't miss this opportunity to experience all that downtown living has to offer!

Ownership History

Date Name Owned For Owner Type

Purchase Details

Listed on
Jan 3, 2024
Closed on
Jan 31, 2024
Sold by
Frashier Robby
Bought by
Cheryl Clark Investments Llc
Seller's Agent
Ophelia Gaskin
Metro West Realty Group LLC
Buyer's Agent
Alexis Emory
Southern Real Estate Properties
List Price
$289,900
Sold Price
$277,900
Premium/Discount to List
-$12,000
-4.14%
Views
24
Current Estimated Value
$288,389

Home Financials for this Owner

Home Financials are based on the most recent Mortgage that was taken out on this home.
Estimated Appreciation
$10,489
Avg. Annual Appreciation
2.15%

Purchase Details

Closed on
Dec 28, 2012
Sold by
Fdic
Bought by
Decatur Properties Ii Inc

Purchase Details

Closed on
Mar 31, 2004
Bought by
Carrollton Lofts Inc
Source: Public Records

Range of Values:

Collateral Analytics

Collateral Analytics Collateral Analytics AVMs (Automated Valuation Model) employ a number of statistical approaches combined with neighborhood-specific comparable selection guarantees the most up-to-date and precise valuations.

Not Available

Collateral Analytics does not have data for the current month. Please view the chart for historical values.

ICE

ICE Mortgage Technology ICE Mortgage Technology’s AVM (Automated Valuation Model) is a state-of-the-art online residential property valuation tool that provides a quick and accurate estimate of the value of almost any home in the U.S.

Not Available

ICE Mortgage Technology does not have data for the current month. Please view the chart for historical values.

First American

First American First American Data & Analytics’ next-generation AVM combines unrivaled data assets with a blended ensemble of valuation models to produce highly accurate, reliable valuations you can trust.

Not Available

First American does not have data for the current month. Please view the chart for historical values.

Quantarium

Quantarium Quantarium’s valuation service, repeatedly proven the industry’s most accurate and comprehensive, is supercharged with a self-learning and auto-tuning AI engine that continually becomes smarter and more accurate as it processes daily inputs from the industry’s leading RE data lake.

Not Available

Quantarium does not have data for the current month. Please view the chart for historical values.

Average Value
Not Available
List Price
Sold Price
Create a Home Valuation Report for This Property
The Home Valuation Report is an in-depth analysis detailing your home's value as well as a comparison with similar homes in the area

Home Values in the Area

Source: Public Records

Average Home Value in this Area


Source: Public Records

Purchase History

Date Buyer Sale Price Title Company
Cheryl Clark Investments Llc $277,900 --
Decatur Properties Ii Inc -- --
Carrollton Lofts Inc -- --
Source: Public Records

Property History

Date Event Price List to Sale Price per Sq Ft Prior Sale
01/31/2024 01/31/24 Sold $277,900 -4.1% $240 / Sq Ft View Prior Sale
01/10/2024 01/10/24 Pending -- -- --
01/03/2024 01/03/24 For Sale $289,900 -- $250 / Sq Ft

Tax History Compared to Growth

Source: Public Records

Tax History

Year Tax Paid Tax Assessment Tax Assessment Total Assessment is a certain percentage of the fair market value that is determined by local assessors to be the total taxable value of land and additions on the property. Land Improvement
2024 $2,440 $89,297 $6,000 $83,297
2023 $2,440 $82,061 $6,000 $76,061
2022 $1,958 $67,078 $6,000 $61,078
2021 $1,716 $58,771 $6,000 $52,771
2020 $1,538 $52,636 $6,000 $46,636
2019 $1,413 $47,918 $6,000 $41,918
2018 $939 $31,380 $2,000 $29,380
2017 $944 $31,380 $2,000 $29,380
2016 $858 $33,380 $4,000 $29,380
2015 $805 $26,072 $4,000 $22,073
2014 $1,059 $26,073 $4,000 $22,073
Source: Public Records

Agents Affiliated with this Home

  • Section Image
  • Section Image
See All Agents

Map