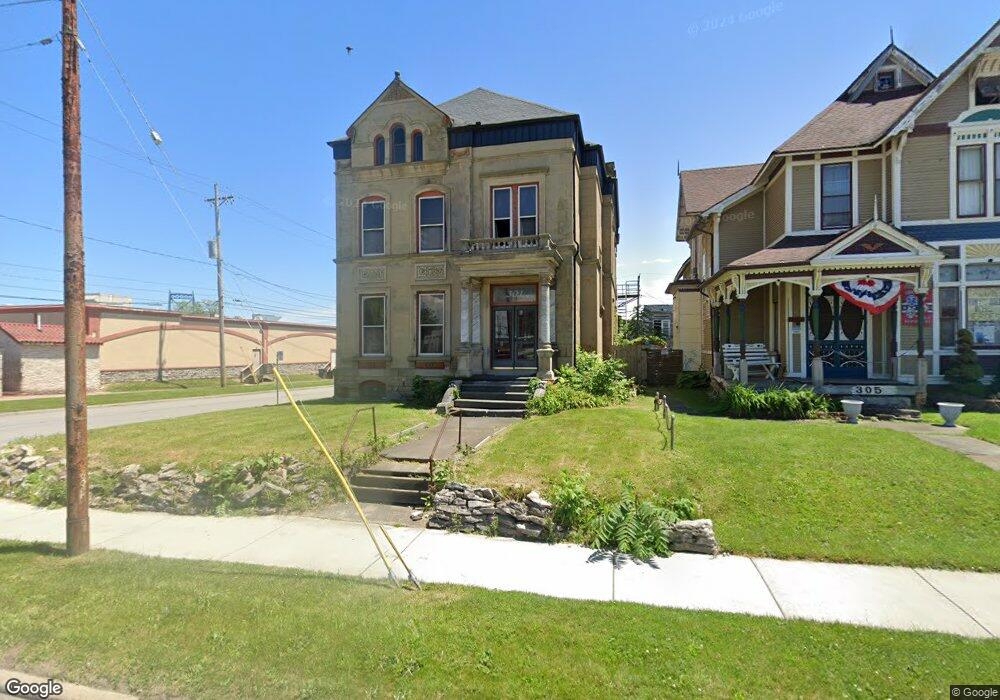
301 Broadway St Toledo, OH 43604
Downtown Toledo NeighborhoodEstimated Value: $115,000 - $165,000
6
Beds
3
Baths
3,492
Sq Ft
$40/Sq Ft
Est. Value
About This Home
This home is located at 301 Broadway St, Toledo, OH 43604 and is currently estimated at $140,620, approximately $40 per square foot. 301 Broadway St is a home located in Lucas County with nearby schools including Marshall Stemm Academy, Waite High School, and Summit Academy - Toledo.
Ownership History
Date
Name
Owned For
Owner Type
Purchase Details
Closed on
Apr 2, 2018
Sold by
Garcia John S and Garcia Charissa F
Bought by
Garcia John S and Garcia Chanrissa F
Current Estimated Value
Purchase Details
Closed on
May 8, 2001
Sold by
Lee Sanzenbacher George and Lee Marianne E
Bought by
Schnapp Hans G
Home Financials for this Owner
Home Financials are based on the most recent Mortgage that was taken out on this home.
Original Mortgage
$80,750
Outstanding Balance
$30,063
Interest Rate
6.99%
Estimated Equity
$110,557
Purchase Details
Closed on
Mar 10, 1989
Sold by
Engel Leroy H
Create a Home Valuation Report for This Property
The Home Valuation Report is an in-depth analysis detailing your home's value as well as a comparison with similar homes in the area
Home Values in the Area
Average Home Value in this Area
Purchase History
| Date | Buyer | Sale Price | Title Company |
|---|---|---|---|
| Garcia John S | -- | None Available | |
| Schnapp Hans G | $85,000 | First Capital Title | |
| -- | $43,500 | -- |
Source: Public Records
Mortgage History
| Date | Status | Borrower | Loan Amount |
|---|---|---|---|
| Open | Schnapp Hans G | $80,750 |
Source: Public Records
Tax History Compared to Growth
Tax History
| Year | Tax Paid | Tax Assessment Tax Assessment Total Assessment is a certain percentage of the fair market value that is determined by local assessors to be the total taxable value of land and additions on the property. | Land | Improvement |
|---|---|---|---|---|
| 2024 | $725 | $18,795 | $1,750 | $17,045 |
| 2023 | $1,520 | $19,460 | $1,925 | $17,535 |
| 2022 | $1,516 | $19,460 | $1,925 | $17,535 |
| 2021 | $1,530 | $19,460 | $1,925 | $17,535 |
| 2020 | $1,524 | $16,870 | $1,645 | $15,225 |
| 2019 | $1,501 | $16,870 | $1,645 | $15,225 |
| 2018 | $1,501 | $16,870 | $1,645 | $15,225 |
| 2017 | $1,531 | $16,485 | $1,610 | $14,875 |
| 2016 | $1,533 | $47,100 | $4,600 | $42,500 |
| 2015 | $1,517 | $47,100 | $4,600 | $42,500 |
| 2014 | $1,037 | $16,490 | $1,610 | $14,880 |
| 2013 | $1,037 | $16,490 | $1,610 | $14,880 |
Source: Public Records
Map
Nearby Homes