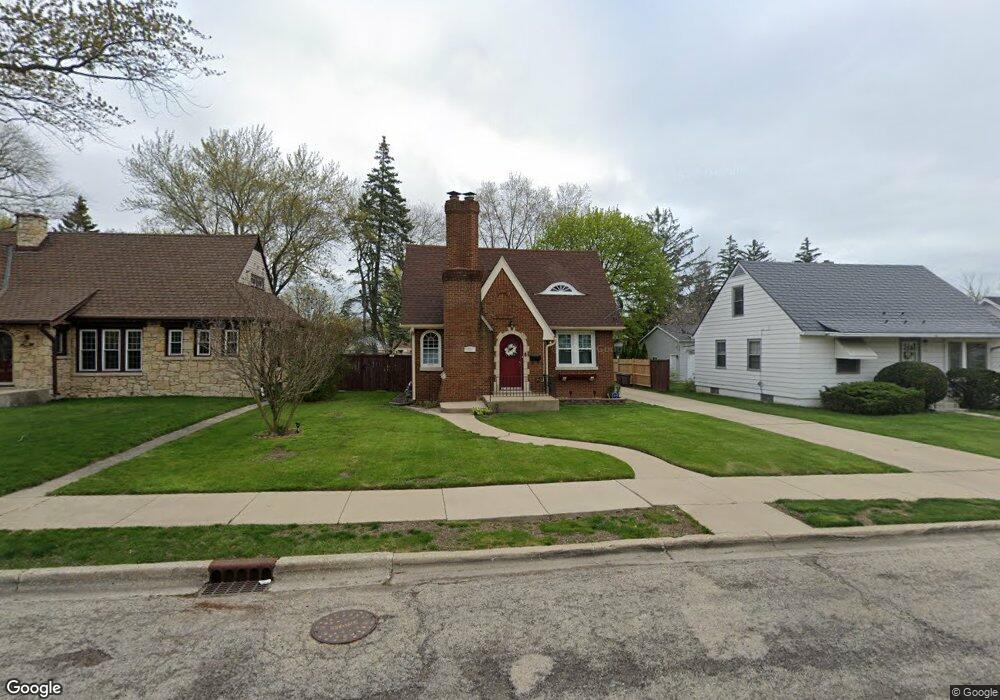
301 Burton St Waukegan, IL 60085
West Waukegan NeighborhoodEstimated Value: $246,000 - $309,000
4
Beds
2
Baths
1,905
Sq Ft
$142/Sq Ft
Est. Value
About This Home
This home is located at 301 Burton St, Waukegan, IL 60085 and is currently estimated at $269,974, approximately $141 per square foot. 301 Burton St is a home located in Lake County with nearby schools including Hyde Park Elementary School, Miguel Juarez Middle School, and Waukegan High School.
Ownership History
Date
Name
Owned For
Owner Type
Purchase Details
Closed on
Jan 10, 2018
Sold by
Neira Gonzalo O
Bought by
Neira Gonzalo O and Neira Maribel
Current Estimated Value
Purchase Details
Closed on
Nov 13, 2009
Sold by
Secretary Of Housing & Urban Development
Bought by
Neira Gonzalo O
Home Financials for this Owner
Home Financials are based on the most recent Mortgage that was taken out on this home.
Original Mortgage
$103,378
Outstanding Balance
$66,881
Interest Rate
4.9%
Mortgage Type
FHA
Estimated Equity
$203,093
Purchase Details
Closed on
Feb 11, 2009
Sold by
Labelle
Bought by
Secretary Of Housing & Urban Development
Purchase Details
Closed on
Apr 27, 2005
Sold by
Wallace John H and Wallace Alta M
Bought by
Labelle Tamika
Home Financials for this Owner
Home Financials are based on the most recent Mortgage that was taken out on this home.
Original Mortgage
$135,200
Interest Rate
7.05%
Mortgage Type
Fannie Mae Freddie Mac
Create a Home Valuation Report for This Property
The Home Valuation Report is an in-depth analysis detailing your home's value as well as a comparison with similar homes in the area
Home Values in the Area
Average Home Value in this Area
Purchase History
| Date | Buyer | Sale Price | Title Company |
|---|---|---|---|
| Neira Gonzalo O | -- | None Available | |
| Neira Gonzalo O | -- | Stewart Title Company | |
| Secretary Of Housing & Urban Development | -- | None Available | |
| Labelle Tamika | $169,000 | First American Title |
Source: Public Records
Mortgage History
| Date | Status | Borrower | Loan Amount |
|---|---|---|---|
| Open | Neira Gonzalo O | $103,378 | |
| Previous Owner | Labelle Tamika | $135,200 | |
| Closed | Labelle Tamika | $33,800 |
Source: Public Records
Tax History Compared to Growth
Tax History
| Year | Tax Paid | Tax Assessment Tax Assessment Total Assessment is a certain percentage of the fair market value that is determined by local assessors to be the total taxable value of land and additions on the property. | Land | Improvement |
|---|---|---|---|---|
| 2024 | $5,369 | $72,535 | $11,318 | $61,217 |
| 2023 | $4,889 | $64,941 | $10,133 | $54,808 |
| 2022 | $4,889 | $56,015 | $9,238 | $46,777 |
| 2021 | $4,633 | $50,439 | $8,701 | $41,738 |
| 2020 | $4,646 | $46,990 | $8,106 | $38,884 |
| 2019 | $4,624 | $43,059 | $7,428 | $35,631 |
| 2018 | $4,013 | $37,419 | $8,761 | $28,658 |
| 2017 | $3,856 | $33,105 | $7,751 | $25,354 |
| 2016 | $3,518 | $28,767 | $6,735 | $22,032 |
| 2015 | $3,336 | $25,747 | $6,028 | $19,719 |
| 2014 | $2,706 | $21,536 | $6,518 | $15,018 |
| 2012 | $4,272 | $26,936 | $7,061 | $19,875 |
Source: Public Records
Map
Nearby Homes
- 1416 Hamilton Ct
- 2115 Lydia St
- 49 S Lewis Ave
- 1521 Catalpa Ave
- 1213 Grand Ave
- 23 N Jackson St
- 615 Tiffany Dr
- 824 N Butrick St
- 0 Brookside Ave
- 511 Chestnut St
- 28 N Saint James St
- 428 N Poplar St
- 1109 Massena Ave
- 522 N Poplar St
- 968 Judge Ave
- 702 Franklin St
- 620 N Poplar St
- 1005 N Lewis Ave
- 917 N Linden Ave
- 613 Washington St
- 221 Burton St
- 305 Burton St
- 304 Lorraine Ave
- 308 Lorraine Ave
- 236 Lorraine Ave
- 309 Burton St
- 1710 W Monroe St
- 310 Lorraine Ave
- 215 Burton St
- 1708 W Monroe St
- 228 Lorraine Ave
- 302 Burton St
- 224 Burton St
- 306 Burton St
- 1715 Brookside Ave
- 321 Burton St
- 220 Burton St
- 1711 Brookside Ave
- 310 Burton St
- 1703 Brookside Ave