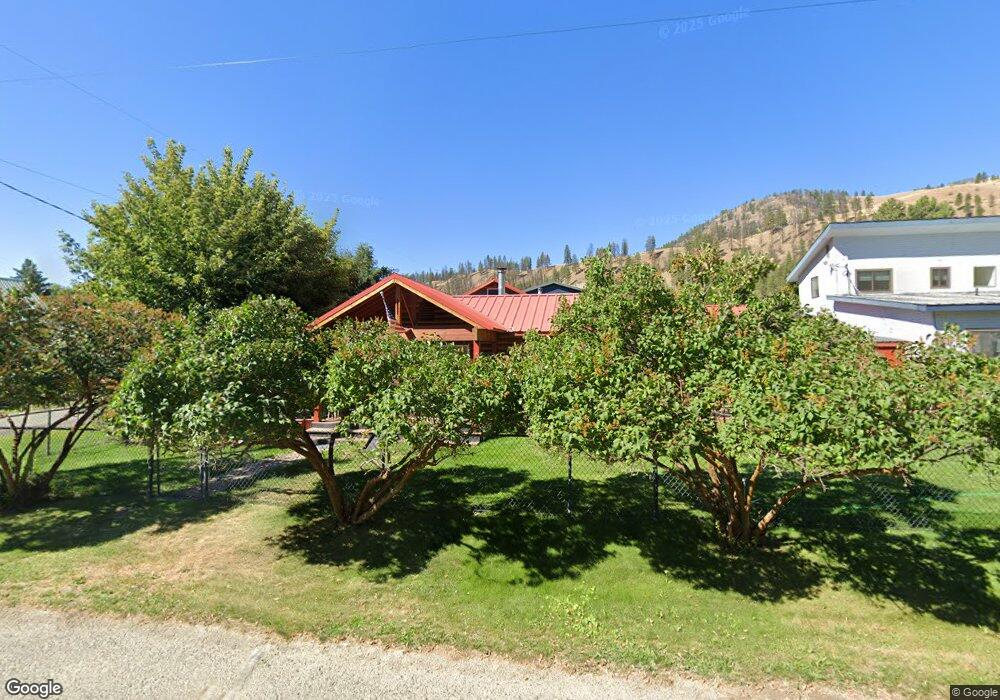
301 C Ave Conconully, WA 98819
Estimated Value: $383,680 - $408,000
2
Beds
2
Baths
1,504
Sq Ft
$263/Sq Ft
Est. Value
About This Home
This home is located at 301 C Ave, Conconully, WA 98819 and is currently estimated at $395,920, approximately $263 per square foot. 301 C Ave is a home located in Okanogan County with nearby schools including North Omak Elementary School, East Omak Elementary School, and Omak Middle School.
Ownership History
Date
Name
Owned For
Owner Type
Purchase Details
Closed on
Sep 13, 2018
Sold by
Tumbleston Sandra J and Tumbleston Ernest T
Bought by
Rockman Christine
Current Estimated Value
Purchase Details
Closed on
Jun 8, 2010
Sold by
George Joe D and George Bitsi R
Bought by
Tumbleston Sandra J and Tumbleston Ernest T
Home Financials for this Owner
Home Financials are based on the most recent Mortgage that was taken out on this home.
Original Mortgage
$123,200
Interest Rate
5.03%
Mortgage Type
New Conventional
Purchase Details
Closed on
Aug 24, 2005
Sold by
Motes Donald R and Motes Colleen L
Bought by
George Joe D and George Bitsi R
Home Financials for this Owner
Home Financials are based on the most recent Mortgage that was taken out on this home.
Original Mortgage
$83,500
Interest Rate
5.61%
Mortgage Type
New Conventional
Create a Home Valuation Report for This Property
The Home Valuation Report is an in-depth analysis detailing your home's value as well as a comparison with similar homes in the area
Purchase History
| Date | Buyer | Sale Price | Title Company |
|---|---|---|---|
| Rockman Christine | $205,000 | Inland Professional Title Ll | |
| Tumbleston Sandra J | $154,000 | Inland Professional Title | |
| George Joe D | $123,500 | Transnation Title |
Source: Public Records
Mortgage History
| Date | Status | Borrower | Loan Amount |
|---|---|---|---|
| Previous Owner | Tumbleston Sandra J | $123,200 | |
| Previous Owner | George Joe D | $83,500 | |
| Closed | Rockman Christine | $0 |
Source: Public Records
Tax History
| Year | Tax Paid | Tax Assessment Tax Assessment Total Assessment is a certain percentage of the fair market value that is determined by local assessors to be the total taxable value of land and additions on the property. | Land | Improvement |
|---|---|---|---|---|
| 2025 | $2,072 | $322,100 | $69,300 | $252,800 |
| 2024 | $2,072 | $243,300 | $55,700 | $187,600 |
| 2022 | $1,867 | $169,400 | $55,700 | $113,700 |
| 2021 | $1,754 | $169,400 | $55,700 | $113,700 |
| 2020 | $1,703 | $169,400 | $55,700 | $113,700 |
| 2019 | $1,617 | $169,400 | $55,700 | $113,700 |
| 2018 | $1,902 | $155,800 | $32,200 | $123,600 |
| 2017 | $1,717 | $155,800 | $32,200 | $123,600 |
| 2016 | $1,693 | $155,800 | $32,200 | $123,600 |
| 2015 | $1,615 | $155,800 | $32,200 | $123,600 |
| 2013 | -- | $155,800 | $32,200 | $123,600 |
Source: Public Records
Map
Nearby Homes
- 117 Lake St E
- 408 Main St
- 119 N Main St
- 0 XX3 N Main St
- 0 XX1 N Main St
- 0 XX4 N Main St
- 0 XX6 N Main St
- 0 XX5 N Main St
- 1425 Salmon Creek Rd
- 156 Poechmann Rd
- 0 Tbd Buzzard Lake Rd
- 212 Hubbard Rd
- 171 Garrett
- 0 Way
- 0 Tbd Pharr Out - 2 Way
- 0 Way
- 0 Tbd Pharr Out - 7 Way
- 0 Tbd Pharr Out - 11 Way
- 0 Tbd Pharr Out - 9 Way
- 0 Tbd Pharr Out - 13 Way
Your Personal Tour Guide
Ask me questions while you tour the home.