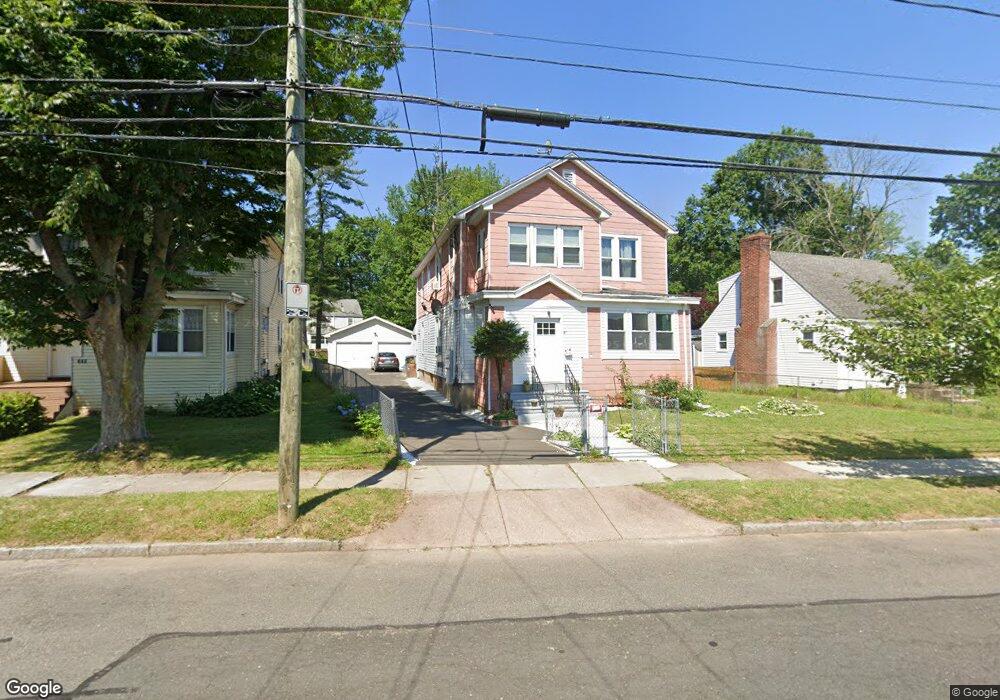
301 Campfield Ave Unit 303 Hartford, CT 06114
South End NeighborhoodEstimated Value: $336,000 - $471,000
4
Beds
3
Baths
2,392
Sq Ft
$157/Sq Ft
Est. Value
About This Home
This home is located at 301 Campfield Ave Unit 303, Hartford, CT 06114 and is currently estimated at $374,726, approximately $156 per square foot. 301 Campfield Ave Unit 303 is a home located in Hartford County with nearby schools including Asian Studies School At Dwight/Belizzi School, Dr. James H Naylor/Ccsu Leadership Academy, and M. D. Fox School.
Ownership History
Date
Name
Owned For
Owner Type
Purchase Details
Closed on
Apr 16, 2021
Sold by
Colon Moises Est and Colon
Bought by
Decolon Veronica V
Current Estimated Value
Home Financials for this Owner
Home Financials are based on the most recent Mortgage that was taken out on this home.
Original Mortgage
$206,196
Outstanding Balance
$185,766
Interest Rate
3%
Mortgage Type
FHA
Estimated Equity
$188,960
Purchase Details
Closed on
May 23, 2017
Sold by
Colon Iris
Bought by
Colon Moises
Purchase Details
Closed on
Jul 3, 2001
Sold by
Peoples Bk
Bought by
Palaquibay Jorge
Home Financials for this Owner
Home Financials are based on the most recent Mortgage that was taken out on this home.
Original Mortgage
$93,100
Interest Rate
7.14%
Purchase Details
Closed on
Jul 11, 1997
Sold by
Macca Joseph and Macca Teresa
Bought by
Brown Frederick
Create a Home Valuation Report for This Property
The Home Valuation Report is an in-depth analysis detailing your home's value as well as a comparison with similar homes in the area
Home Values in the Area
Average Home Value in this Area
Purchase History
| Date | Buyer | Sale Price | Title Company |
|---|---|---|---|
| Decolon Veronica V | $210,000 | None Available | |
| Decolon Veronica V | $210,000 | None Available | |
| Colon Moises | -- | -- | |
| Colon Moises | -- | -- | |
| Palaquibay Jorge | $103,500 | -- | |
| Brown Frederick | $100,000 | -- | |
| Brown Frederick | $100,000 | -- |
Source: Public Records
Mortgage History
| Date | Status | Borrower | Loan Amount |
|---|---|---|---|
| Open | Decolon Veronica V | $206,196 | |
| Closed | Decolon Veronica V | $206,196 | |
| Previous Owner | Brown Frederick | $93,100 | |
| Previous Owner | Brown Frederick | $6,078 |
Source: Public Records
Tax History Compared to Growth
Tax History
| Year | Tax Paid | Tax Assessment Tax Assessment Total Assessment is a certain percentage of the fair market value that is determined by local assessors to be the total taxable value of land and additions on the property. | Land | Improvement |
|---|---|---|---|---|
| 2025 | $5,770 | $83,680 | $10,841 | $72,839 |
| 2024 | $5,559 | $80,630 | $10,841 | $69,789 |
| 2023 | $5,559 | $80,630 | $10,841 | $69,789 |
| 2022 | $4,423 | $80,629 | $10,841 | $69,788 |
| 2021 | $4,423 | $59,535 | $14,280 | $45,255 |
| 2020 | $4,423 | $59,535 | $14,280 | $45,255 |
| 2019 | $4,423 | $59,535 | $14,280 | $45,255 |
| 2018 | $4,274 | $57,528 | $13,799 | $43,729 |
| 2016 | $4,393 | $59,138 | $13,142 | $45,996 |
| 2015 | $4,185 | $56,328 | $12,517 | $43,811 |
| 2014 | $4,082 | $54,951 | $12,211 | $42,740 |
Source: Public Records
Map
Nearby Homes
- 159 Gilman St
- 308 Brown St
- 183 Preston St Unit 185
- 147 Preston St Unit 1
- 152 Otis St
- 71 Hanmer St
- 18 Mclean St Unit 20
- 405 W Preston St Unit 407
- 35 Clifford St
- 218 Grandview Terrace Unit 220
- 390 Fairfield Ave
- 147 Newbury St Unit 149
- 24 Stillman Rd
- 92 Reed Dr
- 61 Preston St Unit 63
- 185 Grandview Terrace Unit 187
- 47 Bolton St
- 5 Wolcott Hill Rd
- 839 Wethersfield Ave
- 69 Mountford St Unit 3A
- 297 Campfield Ave
- 305 Campfield Ave Unit 307
- 309 Campfield Ave Unit 311
- 293 Campfield Ave
- 34 Hubbard Rd
- 38 Hubbard Rd
- 30 Hubbard Rd
- 315 Campfield Ave
- 42 Hubbard Rd
- 26 Hubbard Rd
- 287 Campfield Ave
- 310 Campfield Ave
- 46 Hubbard Rd
- 314 Campfield Ave
- 22 Hubbard Rd
- 321 Campfield Ave
- 318 Campfield Ave
- 18 Hubbard Rd
- 281 Campfield Ave