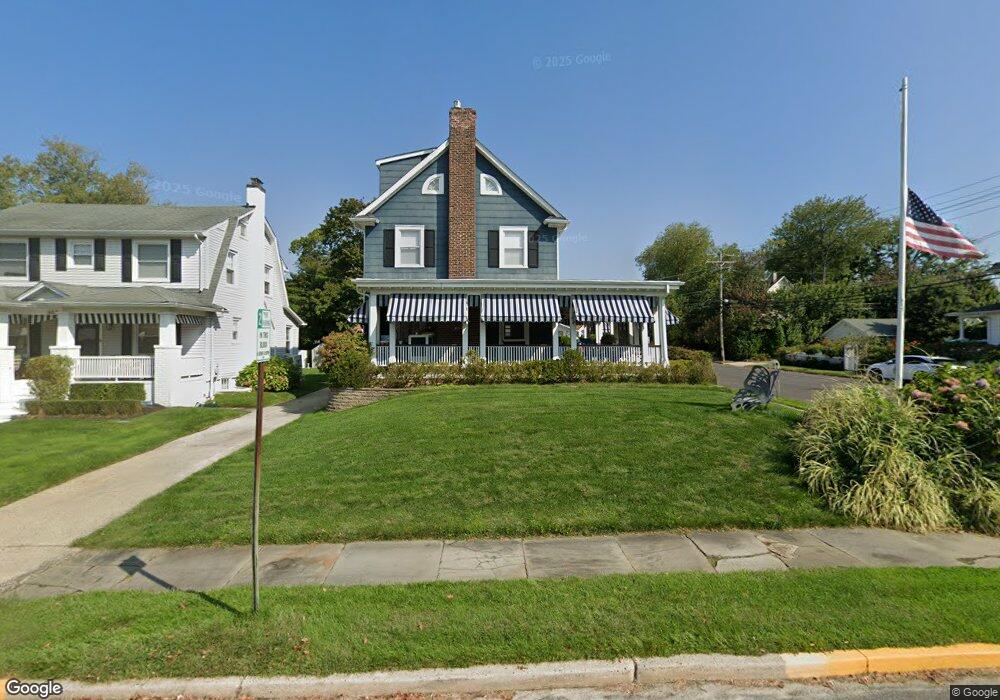
301 Cedar Ave Allenhurst, NJ 07711
Estimated Value: $2,388,022 - $2,822,000
4
Beds
2
Baths
2,253
Sq Ft
$1,139/Sq Ft
Est. Value
About This Home
This home is located at 301 Cedar Ave, Allenhurst, NJ 07711 and is currently estimated at $2,567,007, approximately $1,139 per square foot. 301 Cedar Ave is a home located in Monmouth County with nearby schools including Hope Academy Charter School, St. Mary of the Assumption School, and Bnot Shirah of Deal.
Ownership History
Date
Name
Owned For
Owner Type
Purchase Details
Closed on
Mar 1, 2001
Sold by
Mitchell Helen
Bought by
Cumiskey Richard and Cumiskey Denise
Current Estimated Value
Home Financials for this Owner
Home Financials are based on the most recent Mortgage that was taken out on this home.
Original Mortgage
$268,000
Outstanding Balance
$98,535
Interest Rate
7.15%
Estimated Equity
$2,468,472
Create a Home Valuation Report for This Property
The Home Valuation Report is an in-depth analysis detailing your home's value as well as a comparison with similar homes in the area
Home Values in the Area
Average Home Value in this Area
Purchase History
| Date | Buyer | Sale Price | Title Company |
|---|---|---|---|
| Cumiskey Richard | $335,000 | -- |
Source: Public Records
Mortgage History
| Date | Status | Borrower | Loan Amount |
|---|---|---|---|
| Open | Cumiskey Richard | $268,000 |
Source: Public Records
Tax History
| Year | Tax Paid | Tax Assessment Tax Assessment Total Assessment is a certain percentage of the fair market value that is determined by local assessors to be the total taxable value of land and additions on the property. | Land | Improvement |
|---|---|---|---|---|
| 2025 | $12,198 | $2,292,700 | $1,911,400 | $381,300 |
| 2024 | $9,673 | $2,070,900 | $1,691,200 | $379,700 |
| 2023 | $9,673 | $1,550,200 | $1,192,900 | $357,300 |
| 2022 | $7,474 | $1,142,700 | $823,900 | $318,800 |
| 2021 | $6,320 | $987,300 | $703,700 | $283,600 |
| 2020 | $6,783 | $857,500 | $567,100 | $290,400 |
| 2019 | $6,320 | $795,000 | $506,300 | $288,700 |
| 2018 | $6,187 | $777,200 | $506,300 | $270,900 |
| 2017 | $5,931 | $762,400 | $506,300 | $256,100 |
| 2016 | $5,860 | $704,300 | $464,800 | $239,500 |
| 2015 | $5,727 | $621,200 | $415,000 | $206,200 |
| 2014 | $4,956 | $583,100 | $360,000 | $223,100 |
Source: Public Records
Map
Nearby Homes
- 127 Cedar Ave
- 315 Allen Ave
- 18 Lady Bess Dr
- 48 Neptune Ave
- 57 Hathaway Ave
- 500 Corlies Ave
- 25 Cedar Ave
- 309 Hume St
- 110 Corlies Ave Unit A
- 510 Blanchard Pkwy
- 212 Bridlemere Ave
- 607 Wildwood Rd
- 615 Corlies Ave
- 611 Blanchard Pkwy
- 205 Edgemont Dr Unit 1
- 205 Edgemont Dr Unit 2
- 205 Edgemont Dr Unit 3
- 205 Edgemont Dr Unit BUILDING
- 112 Euclid Ave
- 57 Darlington Rd
Your Personal Tour Guide
Ask me questions while you tour the home.