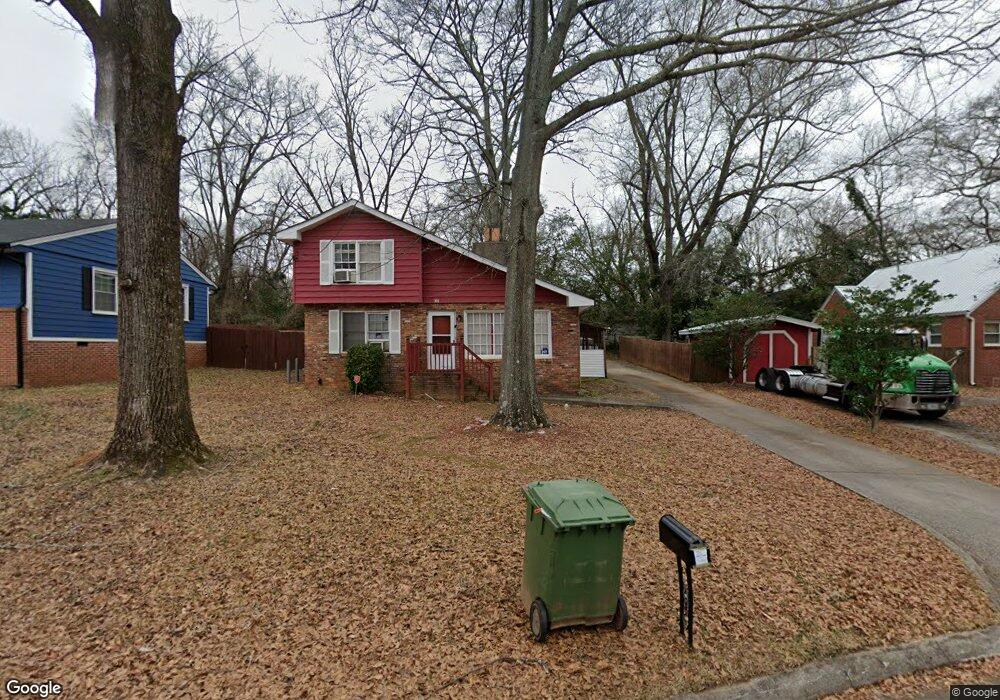
301 Cherokee Cir Griffin, GA 30224
Spalding County NeighborhoodEstimated Value: $107,000 - $164,000
3
Beds
2
Baths
1,332
Sq Ft
$105/Sq Ft
Est. Value
About This Home
This home is located at 301 Cherokee Cir, Griffin, GA 30224 and is currently estimated at $139,459, approximately $104 per square foot. 301 Cherokee Cir is a home located in Spalding County with nearby schools including Anne Street Elementary School, Rehoboth Road Middle School, and Griffin High School.
Ownership History
Date
Name
Owned For
Owner Type
Purchase Details
Closed on
Jan 7, 2019
Sold by
Deerfield Manor Enterprises Llc
Bought by
Whitfield Richard and Whitfield Mary
Current Estimated Value
Home Financials for this Owner
Home Financials are based on the most recent Mortgage that was taken out on this home.
Original Mortgage
$50,595
Outstanding Balance
$32,403
Interest Rate
4.7%
Mortgage Type
New Conventional
Estimated Equity
$107,056
Purchase Details
Closed on
Mar 9, 1984
Sold by
Jones Walter E
Bought by
Janney Harold T and Janney Jerry W
Purchase Details
Closed on
May 1, 1982
Sold by
Sims Herbert R and Sims Tracy A
Bought by
Jones Walter E
Purchase Details
Closed on
Oct 10, 1978
Sold by
Okelley Cecil J and Okelley Betty P
Bought by
Sims Herbert R and Sims Tracy A
Purchase Details
Closed on
Apr 6, 1965
Sold by
Ogeltree Robert S
Bought by
Okelley Cecil J and Okelley Betty P
Purchase Details
Closed on
Aug 30, 1958
Bought by
Ogeltree Robert S
Create a Home Valuation Report for This Property
The Home Valuation Report is an in-depth analysis detailing your home's value as well as a comparison with similar homes in the area
Home Values in the Area
Average Home Value in this Area
Purchase History
| Date | Buyer | Sale Price | Title Company |
|---|---|---|---|
| Whitfield Richard | $50,595 | -- | |
| Janney Harold T | $11,800 | -- | |
| Jones Walter E | $12,400 | -- | |
| Sims Herbert R | $33,300 | -- | |
| Okelley Cecil J | $18,200 | -- | |
| Ogeltree Robert S | $1,700 | -- |
Source: Public Records
Mortgage History
| Date | Status | Borrower | Loan Amount |
|---|---|---|---|
| Open | Whitfield Richard | $50,595 |
Source: Public Records
Tax History Compared to Growth
Tax History
| Year | Tax Paid | Tax Assessment Tax Assessment Total Assessment is a certain percentage of the fair market value that is determined by local assessors to be the total taxable value of land and additions on the property. | Land | Improvement |
|---|---|---|---|---|
| 2024 | $779 | $44,672 | $4,800 | $39,872 |
| 2023 | $779 | $43,146 | $4,800 | $38,346 |
| 2022 | $673 | $37,131 | $4,000 | $33,131 |
| 2021 | $298 | $21,004 | $2,400 | $18,604 |
| 2020 | $716 | $17,926 | $2,400 | $15,526 |
| 2019 | $609 | $14,976 | $2,400 | $12,576 |
| 2018 | $581 | $13,748 | $2,400 | $11,348 |
| 2017 | $568 | $13,748 | $2,400 | $11,348 |
| 2016 | $577 | $13,748 | $2,400 | $11,348 |
| 2015 | $587 | $13,748 | $2,400 | $11,348 |
| 2014 | $605 | $13,748 | $2,400 | $11,348 |
Source: Public Records
Map
Nearby Homes
- 309 Cherokee Cir
- 305 S 18th St
- 1264 Cherokee Ave
- 1313 D F Fuller Dr
- 1054 W College Street Extension
- 1228-1328 Edgewood Ave
- 141 North Expy
- 915 W Poplar St
- 203 Hillside Cir
- 1206 Hillwood Ave
- 1223 W Broad St
- 1126 Wright St
- 1025 W Broad St
- 1106 Wright St
- 1017 W Broad St
- 930 W Broad St
- 822 W Solomon St
- 1022 Beck St
- 717 Scales St
- 306 Louise Ln Unit A
- 303 Cherokee Cir
- 0 Cherokee Cir Unit 8718522
- 0 Cherokee Cir Unit 8177831
- 0 Cherokee Cir Unit 8657033
- 0 Cherokee Cir Unit 8956840
- 0 Cherokee Cir Unit 3234884
- 0 Cherokee Cir Unit 7032948
- 0 Cherokee Cir
- 1236 W Poplar St
- 1246 W Poplar St
- 305 Cherokee Cir
- 1222 W Poplar St
- 302 Cherokee Cir
- 1252 W Poplar St
- 307 Cherokee Cir
- 304 Cherokee Cir Unit 10
- 304 Cherokee Cir
- 1214 W Poplar St
- 306 Cherokee Cir
- 1247 Cherokee Ave