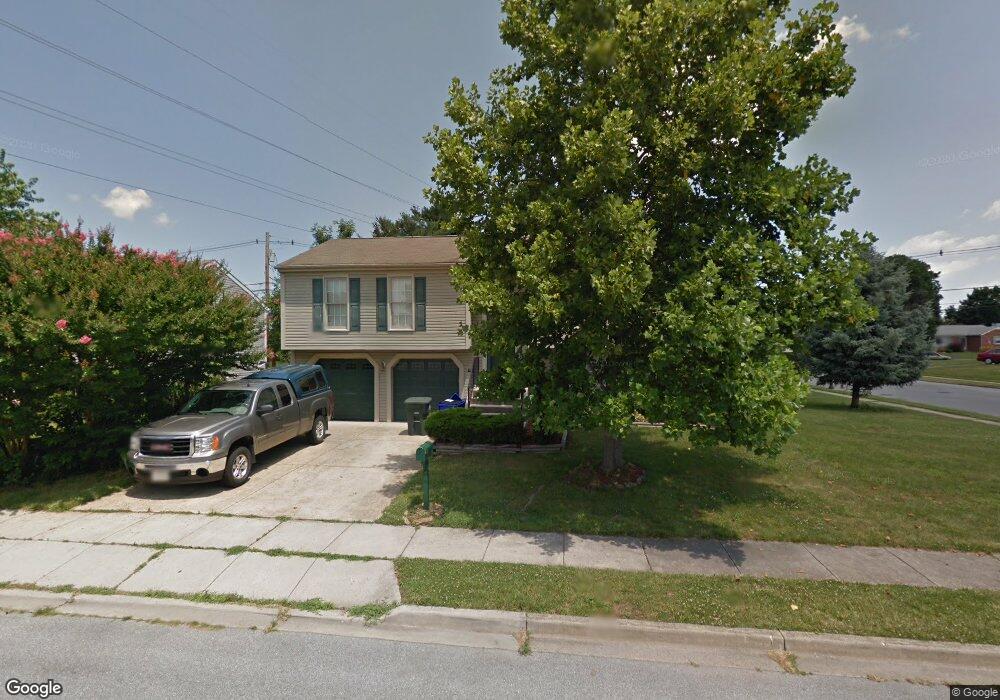
301 Cheyenne Dr Frederick, MD 21701
Monocacy Village NeighborhoodEstimated Value: $389,000 - $434,000
4
Beds
3
Baths
1,080
Sq Ft
$389/Sq Ft
Est. Value
About This Home
This home is located at 301 Cheyenne Dr, Frederick, MD 21701 and is currently estimated at $420,141, approximately $389 per square foot. 301 Cheyenne Dr is a home located in Frederick County with nearby schools including North Frederick Elementary School, Gov. Thomas Johnson Middle School, and Gov. Thomas Johnson High School.
Ownership History
Date
Name
Owned For
Owner Type
Purchase Details
Closed on
Mar 3, 1999
Sold by
Lafollette Roderick M and Lafollette Susan P
Bought by
Morrison Heath C and Morrison Rebecca L
Current Estimated Value
Purchase Details
Closed on
Sep 5, 1990
Sold by
Makela Homes Corp.
Bought by
Lafollette Roderick M and Lafollette Susan P
Home Financials for this Owner
Home Financials are based on the most recent Mortgage that was taken out on this home.
Original Mortgage
$129,200
Interest Rate
10.24%
Create a Home Valuation Report for This Property
The Home Valuation Report is an in-depth analysis detailing your home's value as well as a comparison with similar homes in the area
Home Values in the Area
Average Home Value in this Area
Purchase History
| Date | Buyer | Sale Price | Title Company |
|---|---|---|---|
| Morrison Heath C | $135,000 | -- | |
| Lafollette Roderick M | $137,100 | -- |
Source: Public Records
Mortgage History
| Date | Status | Borrower | Loan Amount |
|---|---|---|---|
| Previous Owner | Lafollette Roderick M | $129,200 | |
| Closed | Morrison Heath C | -- |
Source: Public Records
Tax History
| Year | Tax Paid | Tax Assessment Tax Assessment Total Assessment is a certain percentage of the fair market value that is determined by local assessors to be the total taxable value of land and additions on the property. | Land | Improvement |
|---|---|---|---|---|
| 2025 | $5,367 | $342,300 | $102,900 | $239,400 |
| 2024 | $5,367 | $314,767 | $0 | $0 |
| 2023 | $4,959 | $287,233 | $0 | $0 |
| 2022 | $4,696 | $259,700 | $90,600 | $169,100 |
| 2021 | $4,401 | $251,767 | $0 | $0 |
| 2020 | $4,401 | $243,833 | $0 | $0 |
| 2019 | $4,259 | $235,900 | $84,600 | $151,300 |
| 2018 | $4,225 | $231,933 | $0 | $0 |
| 2017 | $4,113 | $235,900 | $0 | $0 |
| 2016 | $4,010 | $224,000 | $0 | $0 |
| 2015 | $4,010 | $221,667 | $0 | $0 |
| 2014 | $4,010 | $219,333 | $0 | $0 |
Source: Public Records
Map
Nearby Homes
- 924 Lindley Rd
- 828 Geronimo Dr
- 229 E 5th St
- 615 Blandwood Rd
- 103 E 8th St Unit F
- 104 E 7th St
- 1133 Holden Rd
- 1135 Holden Rd
- 747 Holden Rd
- 667 E Church St Unit B
- 20 E 7th St
- 8 W 7th St
- 515 E Church St
- 38 E 6th St
- 426 Chapel Aly
- 418 N Maxwell Ave
- 728 Holden Rd
- 203 E 3rd St
- 20 Maxwell Square
- 15 E 4th St
Your Personal Tour Guide
Ask me questions while you tour the home.