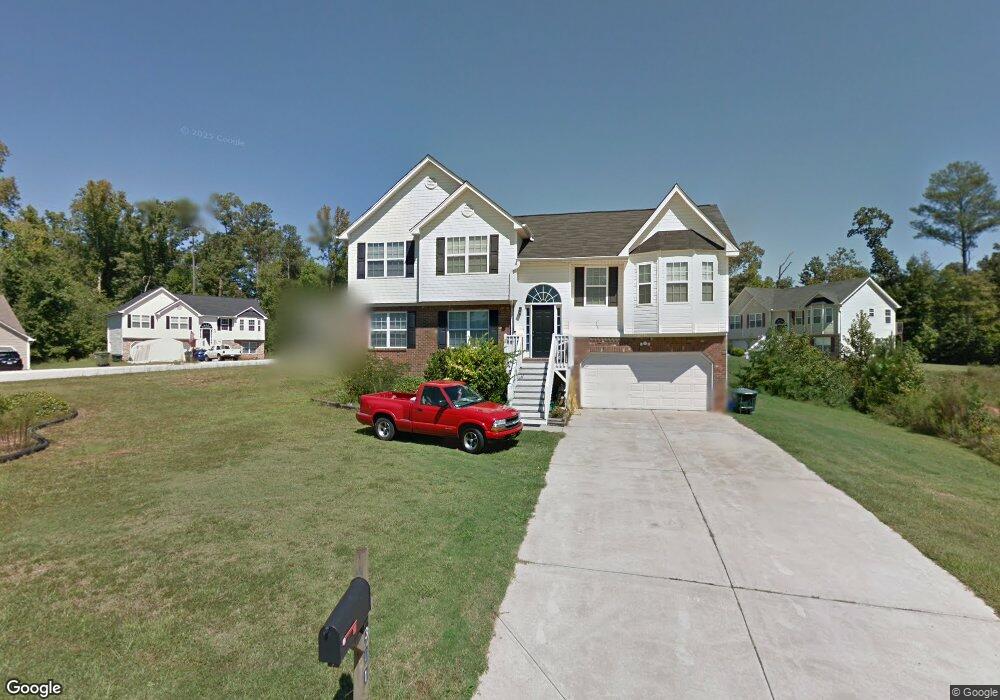
301 Clarion Dr Carrollton, GA 30116
Estimated Value: $278,000 - $309,000
4
Beds
3
Baths
2,120
Sq Ft
$139/Sq Ft
Est. Value
About This Home
This home is located at 301 Clarion Dr, Carrollton, GA 30116 and is currently estimated at $295,539, approximately $139 per square foot. 301 Clarion Dr is a home located in Carroll County with nearby schools including Carrollton Elementary School, Carrollton Upper Elementary School, and Carrollton Middle School.
Ownership History
Date
Name
Owned For
Owner Type
Purchase Details
Closed on
Mar 22, 2019
Sold by
Copeland Michael A
Bought by
Johnson Copeland Michael A and Johnson Copeland Destanie
Current Estimated Value
Home Financials for this Owner
Home Financials are based on the most recent Mortgage that was taken out on this home.
Original Mortgage
$165,938
Outstanding Balance
$146,182
Interest Rate
4.5%
Mortgage Type
FHA
Estimated Equity
$149,357
Purchase Details
Closed on
Jul 30, 2013
Sold by
Trustee Management Svcs In
Bought by
First Stone Reunion Llc
Purchase Details
Closed on
Jun 4, 2013
Sold by
Weaver Ronnie L
Bought by
Trustee Management Svcs Inc Tr and 301 Clarion Dr Trust
Purchase Details
Closed on
Dec 21, 2004
Sold by
A & D Builders Inc
Bought by
Weaver Ronnie
Purchase Details
Closed on
Apr 8, 2004
Sold by
Armor Properties Inc
Bought by
A & D Builders Inc
Purchase Details
Closed on
Nov 26, 2003
Bought by
Armor Properties Inc
Create a Home Valuation Report for This Property
The Home Valuation Report is an in-depth analysis detailing your home's value as well as a comparison with similar homes in the area
Home Values in the Area
Average Home Value in this Area
Purchase History
| Date | Buyer | Sale Price | Title Company |
|---|---|---|---|
| Johnson Copeland Michael A | $169,000 | -- | |
| Copeland Michael A | $169,000 | -- | |
| First Stone Reunion Llc | $127,720 | -- | |
| Trustee Management Svcs Inc Tr | $84,400 | -- | |
| Weaver Ronnie | $146,300 | -- | |
| Weaver Ronnie | $146,300 | -- | |
| A & D Builders Inc | -- | -- | |
| Armor Properties Inc | -- | -- |
Source: Public Records
Mortgage History
| Date | Status | Borrower | Loan Amount |
|---|---|---|---|
| Open | Copeland Michael A | $165,938 | |
| Closed | Johnson Copeland Michael A | $165,938 |
Source: Public Records
Tax History Compared to Growth
Tax History
| Year | Tax Paid | Tax Assessment Tax Assessment Total Assessment is a certain percentage of the fair market value that is determined by local assessors to be the total taxable value of land and additions on the property. | Land | Improvement |
|---|---|---|---|---|
| 2024 | $2,956 | $108,178 | $8,000 | $100,178 |
| 2023 | $2,956 | $99,082 | $8,000 | $91,082 |
| 2022 | $2,311 | $79,162 | $6,000 | $73,162 |
| 2021 | $2,003 | $68,604 | $6,000 | $62,604 |
| 2020 | $1,423 | $48,684 | $6,000 | $42,684 |
| 2019 | $1,436 | $48,684 | $6,000 | $42,684 |
| 2018 | $1,457 | $48,684 | $6,000 | $42,684 |
| 2017 | $1,465 | $48,684 | $6,000 | $42,684 |
| 2016 | $1,473 | $48,684 | $6,000 | $42,684 |
| 2015 | $1,346 | $43,575 | $6,000 | $37,576 |
| 2014 | $1,060 | $34,182 | $6,000 | $28,182 |
Source: Public Records
Map
Nearby Homes
- 103 Hilo Ct
- 690 Horsley Mill Rd
- The Rosewood Plan at Oak Mountain View
- The Northview Plan at Oak Mountain View
- The Newburgh Plan at Oak Mountain View
- The Brookdale Plan at Oak Mountain View
- The Donovan Plan at Oak Mountain View
- The Rochester Plan at Oak Mountain View
- The Wendell Plan at Oak Mountain View
- The Carrollton Plan at Oak Mountain View
- 680 Horsley Mill Rd
- 5 Knob Dr
- 240 Knob Dr
- 205 Turnberry Cir
- 971 Horsley Mill Rd
- 214 Asher Dr
- 116 Camilla Dr
- TRACT 8 Horsley Mill Rd
- 981 Horsley Mill Rd
- TRACT 9 Horsley Mill Rd
- 303 Clarion Dr Unit 23
- 303 Clarion Dr
- 0 Lava Ct Unit 8825150
- 0 Lava Ct
- 101 Hilo Ct
- 101 Hilo Ct
- 105 Lava Ct
- 107 Lava Ct
- 111 Lava Ct
- 103 Lava Ct
- 305 Clarion Dr
- 109 Lava Ct
- 213 Clarion Dr
- 103 Hilo Ct Unit 53
- 0 Hilo Ct Unit 8705664
- 0 Hilo Ct Unit 7622895
- 212 Clarion Dr
- 307 Clarion Dr
- 308 Clarion Dr
- 105 Hilo Ct