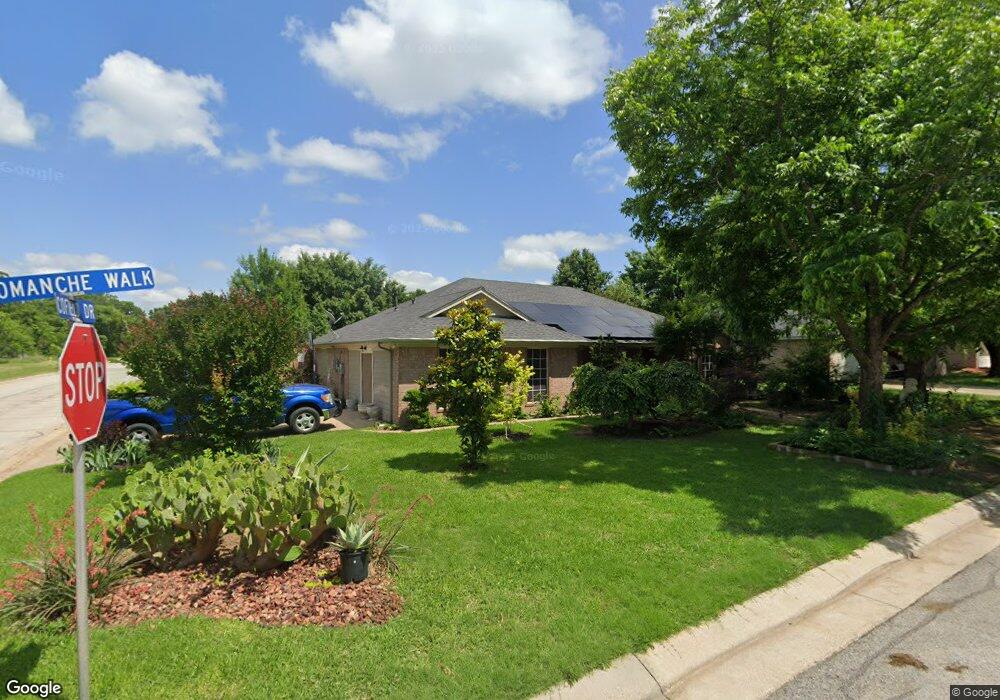
301 Comanche Walk Joshua, TX 76058
Estimated Value: $294,000 - $309,000
3
Beds
2
Baths
1,644
Sq Ft
$184/Sq Ft
Est. Value
About This Home
This home is located at 301 Comanche Walk, Joshua, TX 76058 and is currently estimated at $303,084, approximately $184 per square foot. 301 Comanche Walk is a home located in Johnson County with nearby schools including A.G. Elder Elementary School, Joshua High School, and Joshua High School - 9th Grade Campus.
Ownership History
Date
Name
Owned For
Owner Type
Purchase Details
Closed on
Aug 22, 2016
Sold by
Gamett Steven
Bought by
D & D Tri Angel Investments Llc
Current Estimated Value
Purchase Details
Closed on
Sep 11, 2015
Sold by
Baker Elmo C and Baker Marjorie M
Bought by
Bustillos David A
Home Financials for this Owner
Home Financials are based on the most recent Mortgage that was taken out on this home.
Original Mortgage
$142,025
Interest Rate
4.03%
Mortgage Type
New Conventional
Purchase Details
Closed on
Aug 12, 2013
Sold by
Sullivan Joseph E and Sullivan Lauren G
Bought by
Heb Homes Llc
Purchase Details
Closed on
Apr 25, 2006
Sold by
Whitley Terry and Whitley Laurie
Bought by
Caudle Michael D and Caudle Kimberly M
Home Financials for this Owner
Home Financials are based on the most recent Mortgage that was taken out on this home.
Original Mortgage
$114,000
Interest Rate
6.33%
Mortgage Type
New Conventional
Create a Home Valuation Report for This Property
The Home Valuation Report is an in-depth analysis detailing your home's value as well as a comparison with similar homes in the area
Home Values in the Area
Average Home Value in this Area
Purchase History
| Date | Buyer | Sale Price | Title Company |
|---|---|---|---|
| D & D Tri Angel Investments Llc | -- | Providence Title Co | |
| Bustillos David A | -- | Providence Title Co | |
| Heb Homes Llc | -- | Freedom Title | |
| Caudle Michael D | -- | Alamo Title Company |
Source: Public Records
Mortgage History
| Date | Status | Borrower | Loan Amount |
|---|---|---|---|
| Previous Owner | Bustillos David A | $142,025 | |
| Previous Owner | Caudle Michael D | $114,000 |
Source: Public Records
Tax History Compared to Growth
Tax History
| Year | Tax Paid | Tax Assessment Tax Assessment Total Assessment is a certain percentage of the fair market value that is determined by local assessors to be the total taxable value of land and additions on the property. | Land | Improvement |
|---|---|---|---|---|
| 2025 | $7,996 | $360,214 | $40,000 | $320,214 |
| 2024 | $7,996 | $328,543 | $40,000 | $288,543 |
| 2023 | $7,312 | $328,543 | $40,000 | $288,543 |
| 2022 | $6,600 | $263,029 | $40,000 | $223,029 |
| 2021 | $5,340 | $210,947 | $25,000 | $185,947 |
| 2020 | $5,412 | $197,665 | $25,000 | $172,665 |
| 2019 | $5,687 | $197,665 | $25,000 | $172,665 |
| 2018 | $4,535 | $153,392 | $25,000 | $128,392 |
| 2017 | $4,533 | $153,392 | $25,000 | $128,392 |
| 2016 | $4,153 | $140,530 | $15,000 | $125,530 |
| 2015 | $3,252 | $120,446 | $15,000 | $105,446 |
| 2014 | $3,252 | $120,446 | $15,000 | $105,446 |
Source: Public Records
Map
Nearby Homes
- 304 Comanche Walk
- 312 Comanche Walk
- 414 Dakota Dr
- 527 Lone Star St
- 200 Wayside St
- 520 Palo Duro Dr
- 108 Sally St
- 608 W Sheila Cir
- 107 E 10th St
- 613 W Sheila Cir
- 209 E 8th St
- 628 E Sheila Cir
- 307 Gregory St
- 629 E Sheila Cir
- 102 Carlock St
- 205 Greenhill Dr
- 500 N Main St
- 136 Oak Hill Dr
- 401 Eddy Ave
- 424 N Broadway St Unit 236
- 303 Comanche Walk
- 400 Dakota Dr
- 402 Dakota Dr
- 300 Comanche Walk
- 305 Comanche Walk
- 302 Comanche Walk
- 404 Dakota Dr
- 307 Comanche Walk
- 406 Dakota Dr
- 401 Dakota Dr
- 306 Comanche Walk
- 403 Dakota Dr
- 309 Comanche Walk
- 201 Thomas St
- 405 Dakota Dr
- 408 Dakota Dr
- 203 Thomas St
- 111 Thomas St
- 407 Dakota Dr
- 205 Thomas St