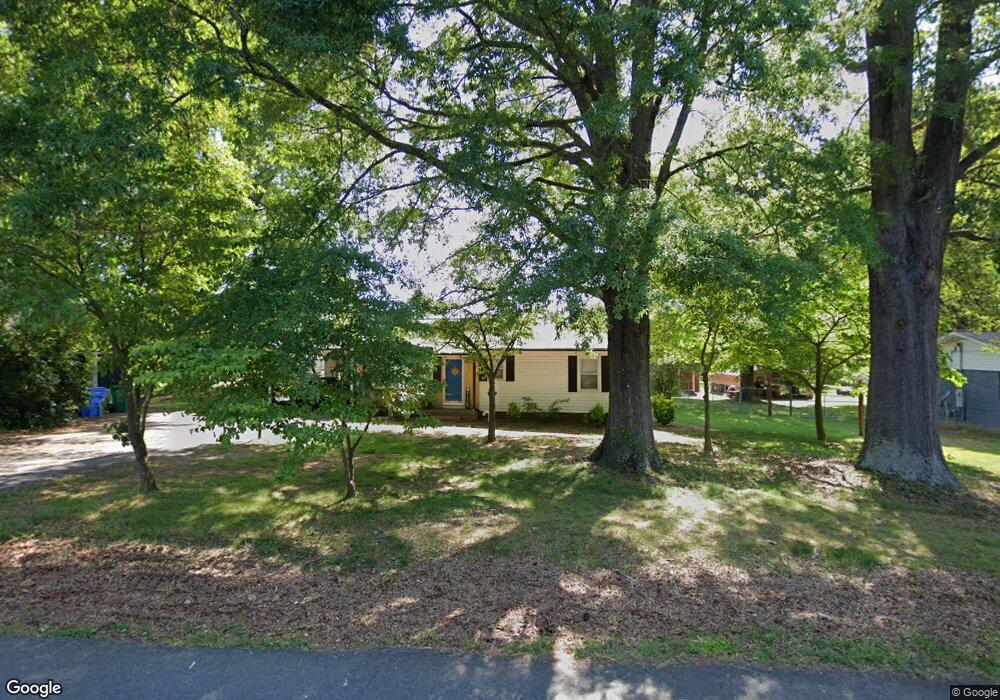
301 Danita Dr Locust, NC 28097
Estimated Value: $185,000 - $287,000
2
Beds
1
Bath
1,040
Sq Ft
$235/Sq Ft
Est. Value
About This Home
This home is located at 301 Danita Dr, Locust, NC 28097 and is currently estimated at $244,105, approximately $234 per square foot. 301 Danita Dr is a home located in Stanly County with nearby schools including Locust Elementary School, West Stanly Middle School, and West Stanly High School.
Ownership History
Date
Name
Owned For
Owner Type
Purchase Details
Closed on
Aug 31, 2021
Sold by
Elevate Properties Llc
Bought by
Crayton Spencer
Current Estimated Value
Home Financials for this Owner
Home Financials are based on the most recent Mortgage that was taken out on this home.
Original Mortgage
$132,000
Outstanding Balance
$120,723
Interest Rate
3.15%
Mortgage Type
New Conventional
Estimated Equity
$123,382
Purchase Details
Closed on
Dec 15, 2014
Sold by
Hartsell James Andrew and Hartsell Leah Kendall
Bought by
Elevate Properties Llc
Purchase Details
Closed on
Nov 30, 2005
Sold by
Hartsell James Andrew
Bought by
Hartsell James Andrew and Hartsell Leah Kendall
Home Financials for this Owner
Home Financials are based on the most recent Mortgage that was taken out on this home.
Original Mortgage
$75,000
Interest Rate
4.75%
Mortgage Type
Adjustable Rate Mortgage/ARM
Create a Home Valuation Report for This Property
The Home Valuation Report is an in-depth analysis detailing your home's value as well as a comparison with similar homes in the area
Home Values in the Area
Average Home Value in this Area
Purchase History
| Date | Buyer | Sale Price | Title Company |
|---|---|---|---|
| Crayton Spencer | $130,000 | None Available | |
| Elevate Properties Llc | -- | None Available | |
| Hartsell James Andrew | -- | None Available |
Source: Public Records
Mortgage History
| Date | Status | Borrower | Loan Amount |
|---|---|---|---|
| Open | Crayton Spencer | $132,000 | |
| Previous Owner | Hartsell James Andrew | $75,000 |
Source: Public Records
Tax History Compared to Growth
Tax History
| Year | Tax Paid | Tax Assessment Tax Assessment Total Assessment is a certain percentage of the fair market value that is determined by local assessors to be the total taxable value of land and additions on the property. | Land | Improvement |
|---|---|---|---|---|
| 2025 | $1,450 | $157,611 | $31,950 | $125,661 |
| 2024 | $926 | $84,966 | $18,879 | $66,087 |
| 2023 | $1,046 | $84,966 | $18,879 | $66,087 |
| 2022 | $1,038 | $84,966 | $18,879 | $66,087 |
| 2021 | $1,029 | $84,966 | $18,879 | $66,087 |
| 2020 | $849 | $65,242 | $16,556 | $48,686 |
| 2019 | $857 | $65,242 | $16,556 | $48,686 |
| 2018 | $737 | $65,242 | $16,556 | $48,686 |
| 2017 | $737 | $65,242 | $16,556 | $48,686 |
| 2016 | $718 | $63,547 | $15,394 | $48,153 |
| 2015 | $836 | $63,547 | $15,394 | $48,153 |
| 2014 | $821 | $63,547 | $15,394 | $48,153 |
Source: Public Records
Map
Nearby Homes
- 117 Danita Dr
- 230 Battery Dr
- 319 N Central Ave
- 219 Kerri Dawn Ln
- 146 Kerri Dawn Ln
- 134 Kerri Dawn Ln
- 417 Kiser Ln
- 206 Delancy St
- 24990 Birdhouse Ln Unit 4
- 716 Saddlebred Ln
- 347 Carolina Hemlock Dr
- 421 Carolina Hemlock Dr
- 206 Montclair Dr
- 110 Forest Dr
- 1631 Meadow Creek Church Rd
- Lot 1 Meadow Creek Church Rd Unit 1
- 402 Church St
- 169 Abigail Ln
- 323 Wendover Dr
- 209 Lagoda Dr