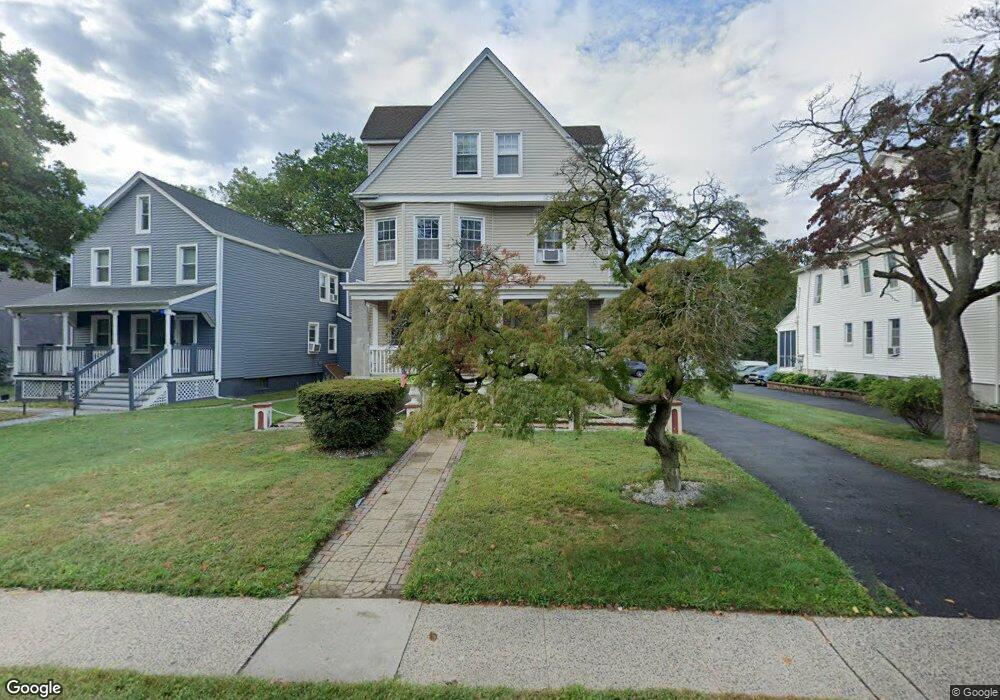
301 Dodd St Unit 3 East Orange, NJ 07017
Estimated Value: $383,000 - $735,000
2
Beds
1
Bath
2,657
Sq Ft
$229/Sq Ft
Est. Value
About This Home
This home is located at 301 Dodd St Unit 3, East Orange, NJ 07017 and is currently estimated at $608,666, approximately $229 per square foot. 301 Dodd St Unit 3 is a home located in Essex County with nearby schools including Johnnie L. Cochran Junior Academy Elementary School, John L Costley Middle School, and Patrick F Healy Middle School.
Ownership History
Date
Name
Owned For
Owner Type
Purchase Details
Closed on
Aug 15, 2017
Sold by
Quinones Christine
Bought by
Quinones Christine and Noriega Franklyn
Current Estimated Value
Purchase Details
Closed on
May 24, 2017
Sold by
Noriega Franklin and Lavine Noriega Janice J
Bought by
Quinones Christine
Home Financials for this Owner
Home Financials are based on the most recent Mortgage that was taken out on this home.
Original Mortgage
$166,920
Interest Rate
4.03%
Mortgage Type
New Conventional
Purchase Details
Closed on
Mar 15, 2002
Sold by
Petroccia Pia
Bought by
Noriega Franklyn and Noriega Janice Lavine
Home Financials for this Owner
Home Financials are based on the most recent Mortgage that was taken out on this home.
Original Mortgage
$120,000
Interest Rate
6.84%
Create a Home Valuation Report for This Property
The Home Valuation Report is an in-depth analysis detailing your home's value as well as a comparison with similar homes in the area
Home Values in the Area
Average Home Value in this Area
Purchase History
| Date | Buyer | Sale Price | Title Company |
|---|---|---|---|
| Quinones Christine | -- | None Available | |
| Quinones Christine | $170,000 | None Available | |
| Noriega Franklyn | $160,000 | -- |
Source: Public Records
Mortgage History
| Date | Status | Borrower | Loan Amount |
|---|---|---|---|
| Previous Owner | Quinones Christine | $166,920 | |
| Previous Owner | Noriega Franklyn | $120,000 |
Source: Public Records
Tax History Compared to Growth
Tax History
| Year | Tax Paid | Tax Assessment Tax Assessment Total Assessment is a certain percentage of the fair market value that is determined by local assessors to be the total taxable value of land and additions on the property. | Land | Improvement |
|---|---|---|---|---|
| 2025 | $13,591 | $429,000 | $109,500 | $319,500 |
| 2024 | $13,591 | $429,000 | $109,500 | $319,500 |
| 2022 | $12,467 | $429,000 | $109,500 | $319,500 |
| 2021 | $14,601 | $263,500 | $83,300 | $180,200 |
| 2020 | $14,413 | $263,500 | $83,300 | $180,200 |
| 2019 | $14,229 | $263,500 | $83,300 | $180,200 |
| 2018 | $14,052 | $263,500 | $83,300 | $180,200 |
| 2017 | $13,660 | $263,500 | $83,300 | $180,200 |
| 2016 | $13,446 | $263,500 | $83,300 | $180,200 |
| 2015 | $13,117 | $263,500 | $83,300 | $180,200 |
| 2014 | $12,933 | $263,500 | $83,300 | $180,200 |
Source: Public Records
Map
Nearby Homes
- 153 Midland Ave
- 54 Linwood Place
- 172 Brighton Ave
- 33 Crescent Rd
- 17 Cottage Place
- 206 Dodd St
- 10 Charles St
- 207 Brighton Ave
- 323 Glenwood Ave
- 323 Glenwood Ave Unit 4
- 73 Fulton St
- 608 Springdale Ave
- 253 Midland Ave
- 77-79 Franklin St
- 19 Dodd Terrace
- 43 Laurel Ave
- 74 Long St Unit 76
- 76 Long St
- 58 Fair St