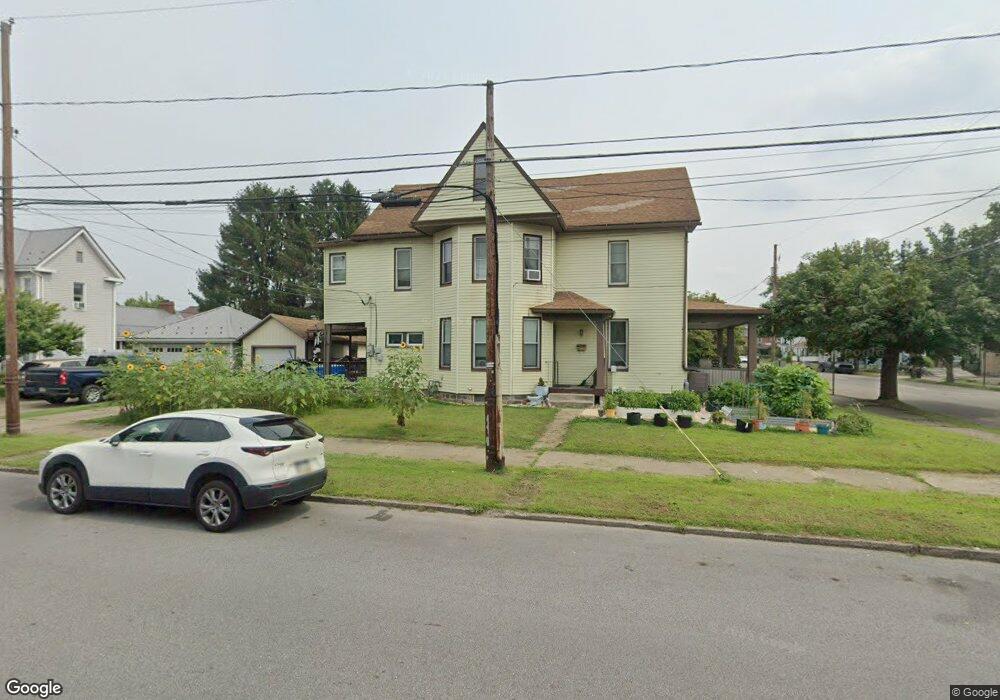
301 E 2nd St Berwick, PA 18603
Estimated Value: $188,000 - $218,000
4
Beds
2
Baths
2,168
Sq Ft
$94/Sq Ft
Est. Value
About This Home
This home is located at 301 E 2nd St, Berwick, PA 18603 and is currently estimated at $203,000, approximately $93 per square foot. 301 E 2nd St is a home located in Columbia County with nearby schools including Berwick Area High School, Holy Family Consolidated School, and New Story School.
Ownership History
Date
Name
Owned For
Owner Type
Purchase Details
Closed on
Aug 31, 2021
Sold by
Town Of Bloomsburg
Bought by
Town Of Bloomburg
Current Estimated Value
Purchase Details
Closed on
Mar 29, 2010
Sold by
Gilbert Paul H and Gilbert Debra T
Bought by
The Town Of Bloomsburg
Purchase Details
Closed on
Jul 1, 2009
Sold by
Citifinancial Services Inc
Bought by
Strauser Wilson H
Home Financials for this Owner
Home Financials are based on the most recent Mortgage that was taken out on this home.
Original Mortgage
$83,711
Interest Rate
5.47%
Mortgage Type
New Conventional
Purchase Details
Closed on
Jun 25, 2009
Sold by
Sheatler Helen
Bought by
Citifinancial Services Inc
Home Financials for this Owner
Home Financials are based on the most recent Mortgage that was taken out on this home.
Original Mortgage
$83,711
Interest Rate
5.47%
Mortgage Type
New Conventional
Create a Home Valuation Report for This Property
The Home Valuation Report is an in-depth analysis detailing your home's value as well as a comparison with similar homes in the area
Home Values in the Area
Average Home Value in this Area
Purchase History
| Date | Buyer | Sale Price | Title Company |
|---|---|---|---|
| Town Of Bloomburg | -- | None Available | |
| The Town Of Bloomsburg | -- | None Available | |
| Strauser Wilson H | $72,700 | None Available | |
| Citifinancial Services Inc | $6,116 | None Available |
Source: Public Records
Mortgage History
| Date | Status | Borrower | Loan Amount |
|---|---|---|---|
| Previous Owner | Strauser Wilson H | $83,711 |
Source: Public Records
Tax History Compared to Growth
Tax History
| Year | Tax Paid | Tax Assessment Tax Assessment Total Assessment is a certain percentage of the fair market value that is determined by local assessors to be the total taxable value of land and additions on the property. | Land | Improvement |
|---|---|---|---|---|
| 2025 | $1,944 | $21,687 | $0 | $0 |
| 2024 | $1,923 | $21,687 | $2,500 | $19,187 |
| 2023 | $1,792 | $21,687 | $2,500 | $19,187 |
| 2022 | $1,733 | $21,687 | $2,500 | $19,187 |
| 2021 | $1,695 | $21,687 | $2,500 | $19,187 |
| 2020 | $1,657 | $21,687 | $2,500 | $19,187 |
| 2019 | $1,631 | $21,687 | $2,500 | $19,187 |
| 2018 | $1,566 | $21,687 | $2,500 | $19,187 |
| 2017 | $1,572 | $21,687 | $2,500 | $19,187 |
| 2016 | -- | $21,687 | $2,500 | $19,187 |
| 2015 | -- | $21,687 | $2,500 | $19,187 |
| 2014 | -- | $21,687 | $2,500 | $19,187 |
Source: Public Records
Map
Nearby Homes
- 300 E 3rd St
- 308 E 3rd St
- 313 E 2nd St
- 235 E 2nd St
- 312 E 3rd St
- 233 E 2nd St
- 111 Chestnut St
- 317 E 2nd St
- 232234 E Third St
- 310 E 2nd St Unit 310 e 2nd st Berwick
- 310 E 2nd St Unit 201 Tower
- 310 E 2nd St Unit Carriage house
- 229 E 2nd St Unit 231
- 321 E 2nd St
- 230 E 3rd St
- 305 E 3rd St
- 301 E Front St
- 318 E 2nd St
- 322 E 3rd St
- 323323 A E Second St