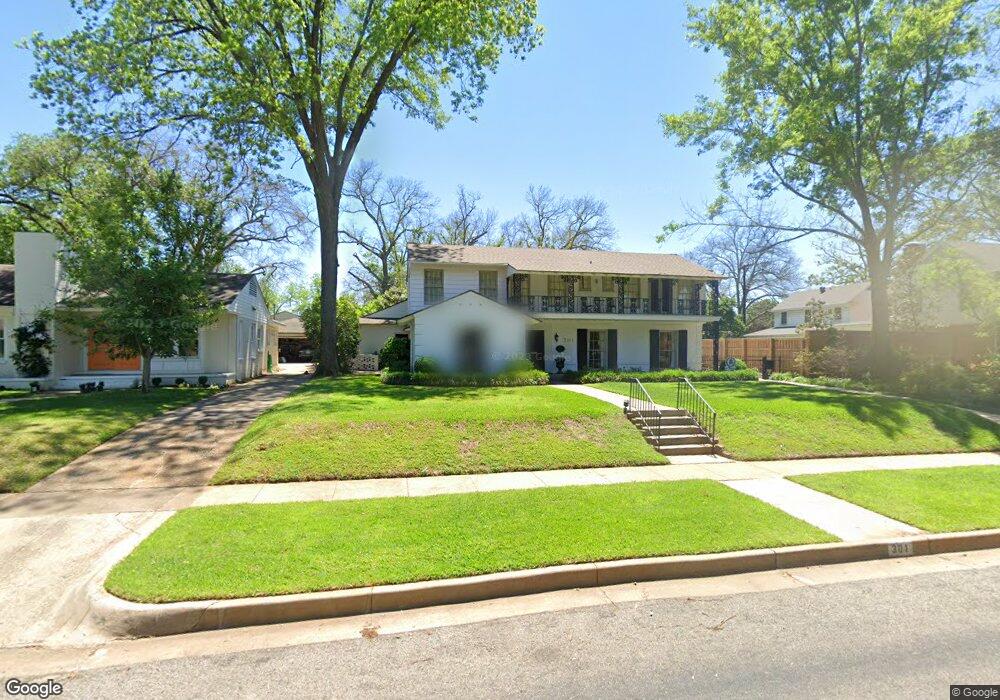
301 E 3rd St Tyler, TX 75701
Azalea District NeighborhoodEstimated Value: $340,000 - $402,000
Studio
3
Baths
2,106
Sq Ft
$176/Sq Ft
Est. Value
About This Home
This home is located at 301 E 3rd St, Tyler, TX 75701 and is currently estimated at $369,885, approximately $175 per square foot. 301 E 3rd St is a home located in Smith County with nearby schools including Bell Elementary School, Hubbard Middle School, and Tyler Legacy High School.
Ownership History
Date
Name
Owned For
Owner Type
Purchase Details
Closed on
May 26, 2010
Sold by
Quinn Paula Patton and Quinn Michael Sean
Bought by
Davis Stafford G and Davis Ashley E
Current Estimated Value
Home Financials for this Owner
Home Financials are based on the most recent Mortgage that was taken out on this home.
Original Mortgage
$253,170
Outstanding Balance
$168,620
Interest Rate
5%
Mortgage Type
New Conventional
Estimated Equity
$201,265
Purchase Details
Closed on
Aug 24, 2007
Sold by
Patton John Jacob
Bought by
Quinn Paula Patton
Home Financials for this Owner
Home Financials are based on the most recent Mortgage that was taken out on this home.
Original Mortgage
$147,000
Interest Rate
6.63%
Mortgage Type
Purchase Money Mortgage
Create a Home Valuation Report for This Property
The Home Valuation Report is an in-depth analysis detailing your home's value as well as a comparison with similar homes in the area
Home Values in the Area
Average Home Value in this Area
Purchase History
| Date | Buyer | Sale Price | Title Company |
|---|---|---|---|
| Davis Stafford G | -- | None Available | |
| Davis Stafford G | -- | None Available | |
| Quinn Paula Patton | -- | None Available | |
| Quinn Paula Patton | -- | None Available |
Source: Public Records
Mortgage History
| Date | Status | Borrower | Loan Amount |
|---|---|---|---|
| Open | Davis Stafford G | $253,170 | |
| Closed | Davis Stafford G | $253,170 | |
| Previous Owner | Quinn Paula Patton | $147,000 |
Source: Public Records
Tax History
| Year | Tax Paid | Tax Assessment Tax Assessment Total Assessment is a certain percentage of the fair market value that is determined by local assessors to be the total taxable value of land and additions on the property. | Land | Improvement |
|---|---|---|---|---|
| 2024 | -- | $372,069 | $42,135 | $329,934 |
| 2023 | $6,487 | $432,575 | $42,135 | $390,440 |
| 2022 | $6,487 | $360,008 | $30,056 | $329,952 |
| 2021 | $7,094 | $358,827 | $30,056 | $328,771 |
| 2020 | $6,623 | $335,346 | $30,056 | $305,290 |
| 2019 | $5,677 | $284,333 | $28,090 | $256,243 |
| 2018 | $5,800 | $284,499 | $28,090 | $256,409 |
| 2017 | $5,768 | $284,499 | $28,090 | $256,409 |
| 2016 | $5,580 | $280,492 | $28,090 | $252,402 |
| 2015 | $5,413 | $280,529 | $28,090 | $252,439 |
| 2014 | $5,413 | $267,188 | $28,090 | $239,098 |
Source: Public Records
Map
Nearby Homes
- 114 E 2nd St
- 325 W 4th St
- 520 E Lake St
- 328 Mockingbird Ln
- 2108 S Wall Ave
- 2003 S Jarrell Ave
- 1931 S Wiley Ave
- 400 Lindsey Ln
- 627 W 2nd St
- 1011 S Chilton Ave
- 310 W Dobbs St
- 128 Rowland Place
- 145 Rowland Place
- 832 S Bois d Arc Ave
- 735 S Donnybrook Ave
- 117 Rowland Place
- 1226 S Fleishel Ave
- 841 S Chilton Ave
- 201 W Rusk St
- 1118 S Fleishel Ave