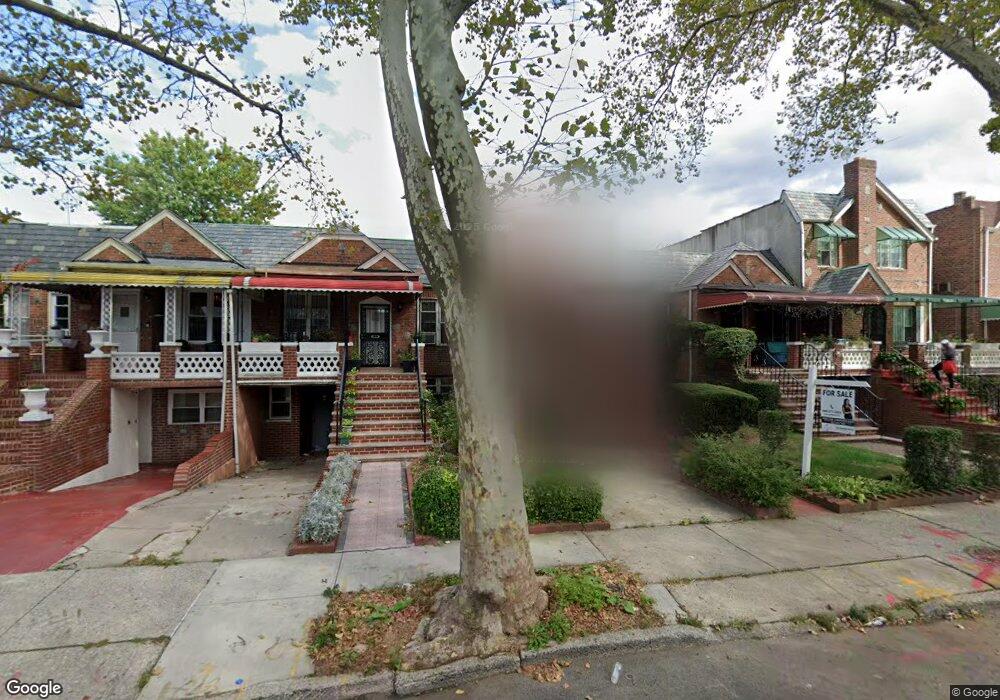
301 E 48th St Brooklyn, NY 11203
East Flatbush NeighborhoodEstimated Value: $664,755 - $888,000
Studio
--
Bath
1,985
Sq Ft
$399/Sq Ft
Est. Value
About This Home
This home is located at 301 E 48th St, Brooklyn, NY 11203 and is currently estimated at $791,939, approximately $398 per square foot. 301 E 48th St is a home located in Kings County with nearby schools including Ps 135 Sheldon A Brookner, East Flatbush Community Research School, and East Flatbush Ascend Charter School.
Ownership History
Date
Name
Owned For
Owner Type
Purchase Details
Closed on
Jul 1, 1997
Sold by
Harris Samuel and Harris Elzie M
Bought by
Harris Elzie M
Current Estimated Value
Purchase Details
Closed on
Oct 1, 1996
Sold by
Value Associates Corp
Bought by
Harris Samuel and Harris Elzie M
Home Financials for this Owner
Home Financials are based on the most recent Mortgage that was taken out on this home.
Original Mortgage
$93,750
Outstanding Balance
$8,615
Interest Rate
8.1%
Estimated Equity
$783,324
Purchase Details
Closed on
Dec 26, 1995
Sold by
Federal Home Loan Mortgage Corporation
Bought by
Value Associates Corp
Create a Home Valuation Report for This Property
The Home Valuation Report is an in-depth analysis detailing your home's value as well as a comparison with similar homes in the area
Home Values in the Area
Average Home Value in this Area
Purchase History
| Date | Buyer | Sale Price | Title Company |
|---|---|---|---|
| Harris Elzie M | -- | Fidelity National Title Ins | |
| Harris Elzie M | -- | Fidelity National Title Ins | |
| Harris Samuel | $125,000 | -- | |
| Harris Samuel | $125,000 | -- | |
| Value Associates Corp | $85,000 | -- | |
| Value Associates Corp | $85,000 | -- |
Source: Public Records
Mortgage History
| Date | Status | Borrower | Loan Amount |
|---|---|---|---|
| Open | Harris Samuel | $93,750 | |
| Closed | Harris Samuel | $93,750 |
Source: Public Records
Tax History
| Year | Tax Paid | Tax Assessment Tax Assessment Total Assessment is a certain percentage of the fair market value that is determined by local assessors to be the total taxable value of land and additions on the property. | Land | Improvement |
|---|---|---|---|---|
| 2025 | $6,053 | $40,020 | $14,280 | $25,740 |
| 2024 | $6,053 | $42,540 | $14,280 | $28,260 |
| 2023 | $6,120 | $45,180 | $14,280 | $30,900 |
| 2022 | $4,315 | $39,840 | $14,280 | $25,560 |
| 2021 | $5,918 | $39,060 | $14,280 | $24,780 |
| 2019 | $5,205 | $36,120 | $14,280 | $21,840 |
| 2018 | $5,060 | $26,280 | $10,154 | $16,126 |
| 2017 | $4,840 | $25,214 | $12,905 | $12,309 |
| 2016 | $4,609 | $24,606 | $11,483 | $13,123 |
| 2015 | $2,649 | $23,214 | $14,045 | $9,169 |
| 2014 | $2,649 | $21,900 | $15,900 | $6,000 |
Source: Public Records
Map
Nearby Homes
Your Personal Tour Guide
Ask me questions while you tour the home.