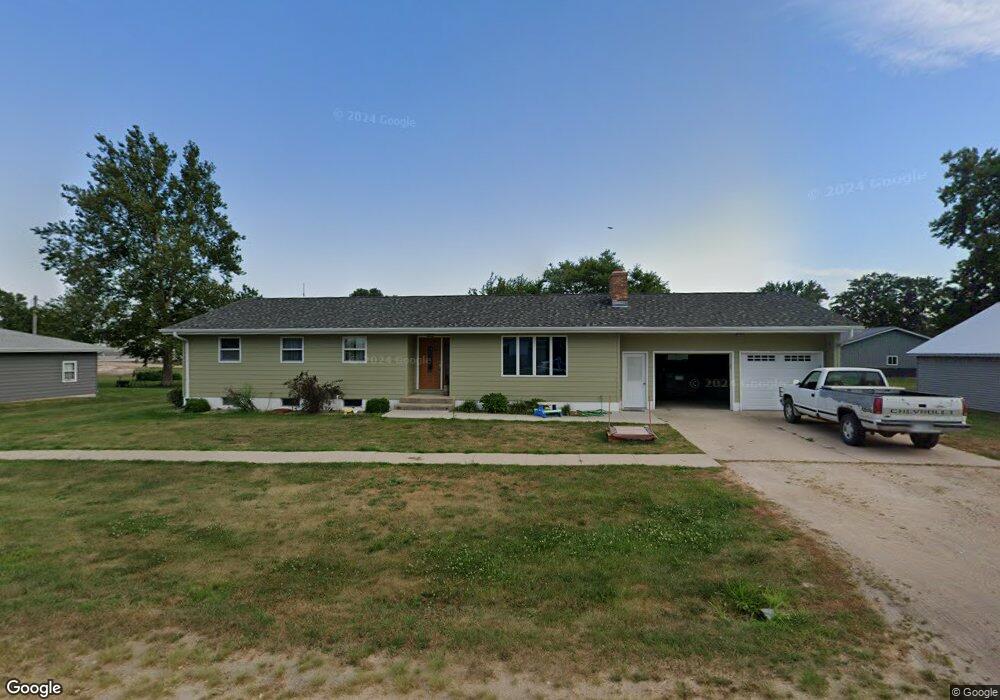
301 E 4th St Stuart, NE 68780
Estimated Value: $164,000 - $246,163
Studio
1
Bath
1,635
Sq Ft
$126/Sq Ft
Est. Value
About This Home
This home is located at 301 E 4th St, Stuart, NE 68780 and is currently estimated at $206,791, approximately $126 per square foot. 301 E 4th St is a home with nearby schools including Stuart Elementary School and Stuart High School.
Ownership History
Date
Name
Owned For
Owner Type
Purchase Details
Closed on
Oct 17, 2019
Sold by
Tiffany Schultz
Bought by
King Devan C and Cullen Sara A
Current Estimated Value
Purchase Details
Closed on
Feb 3, 2013
Sold by
Kohle Amy M
Bought by
Wolf Amy M and Wolf Jared L
Home Financials for this Owner
Home Financials are based on the most recent Mortgage that was taken out on this home.
Original Mortgage
$101,000
Interest Rate
3.44%
Purchase Details
Closed on
Jun 26, 2009
Sold by
Posvar Tobias M and Posvar Lori A
Bought by
Kohle Amy M
Purchase Details
Closed on
Jun 24, 2009
Sold by
Posvar Tobias M and Posvar Lori A
Bought by
Kohle Amy M
Purchase Details
Closed on
Jun 29, 2007
Sold by
Stuart Community Church Inc
Bought by
Posvar Tobias M and Posvar Lori A
Home Financials for this Owner
Home Financials are based on the most recent Mortgage that was taken out on this home.
Original Mortgage
$100,000
Interest Rate
6.41%
Mortgage Type
Construction
Create a Home Valuation Report for This Property
The Home Valuation Report is an in-depth analysis detailing your home's value as well as a comparison with similar homes in the area
Purchase History
| Date | Buyer | Sale Price | Title Company |
|---|---|---|---|
| King Devan C | $175,000 | -- | |
| Wolf Amy M | -- | -- | |
| Kohle Amy M | -- | -- | |
| Kohle Amy M | $115,000 | -- | |
| Posvar Tobias M | $85,000 | -- |
Source: Public Records
Mortgage History
| Date | Status | Borrower | Loan Amount |
|---|---|---|---|
| Previous Owner | Wolf Amy M | $101,000 | |
| Previous Owner | Posvar Tobias M | $100,000 |
Source: Public Records
Tax History
| Year | Tax Paid | Tax Assessment Tax Assessment Total Assessment is a certain percentage of the fair market value that is determined by local assessors to be the total taxable value of land and additions on the property. | Land | Improvement |
|---|---|---|---|---|
| 2025 | $3,124 | $207,118 | $23,824 | $183,294 |
| 2024 | $3,101 | $192,360 | $22,287 | $170,073 |
| 2023 | $3,877 | $192,885 | $19,981 | $172,904 |
| 2022 | $3,364 | $168,004 | $17,676 | $150,328 |
| 2021 | $2,927 | $153,807 | $13,833 | $139,974 |
| 2020 | $2,998 | $153,807 | $13,833 | $139,974 |
| 2019 | $2,841 | $151,995 | $13,833 | $138,162 |
| 2018 | $2,578 | $145,282 | $13,833 | $131,449 |
| 2017 | $1,886 | $108,878 | $13,833 | $95,045 |
| 2016 | $1,745 | $101,635 | $6,590 | $95,045 |
| 2015 | $1,790 | $101,635 | $6,590 | $95,045 |
| 2014 | $1,928 | $101,635 | $6,590 | $95,045 |
| 2011 | $1,842 | $87,210 | $6,590 | $80,620 |
Source: Public Records
Map
Nearby Homes
- 320 +/- Acres Holt County
- 411 N Parnell St
- 135 Garfield St
- 136 N Grant St
- 87792 N Carberry St
- 00 St John's Dr
- 403 Paul St
- 504 N Williams St
- 405 N Main St
- 302 E 4th St
- 120 W State St
- 406 S Williams St
- 305 S Williams St
- 108 E South St
- 509 E 2nd St
- 81.92 + - Acres Unit Rock County Nebraska
- 757.21 + - Acres Unit Rock County Nebraska
- 320 + - Acres Unit Holt County
- 320 +/- Acres Holt County
- 75.86 + - Acres Unit Rock County Nebraska
Your Personal Tour Guide
Ask me questions while you tour the home.