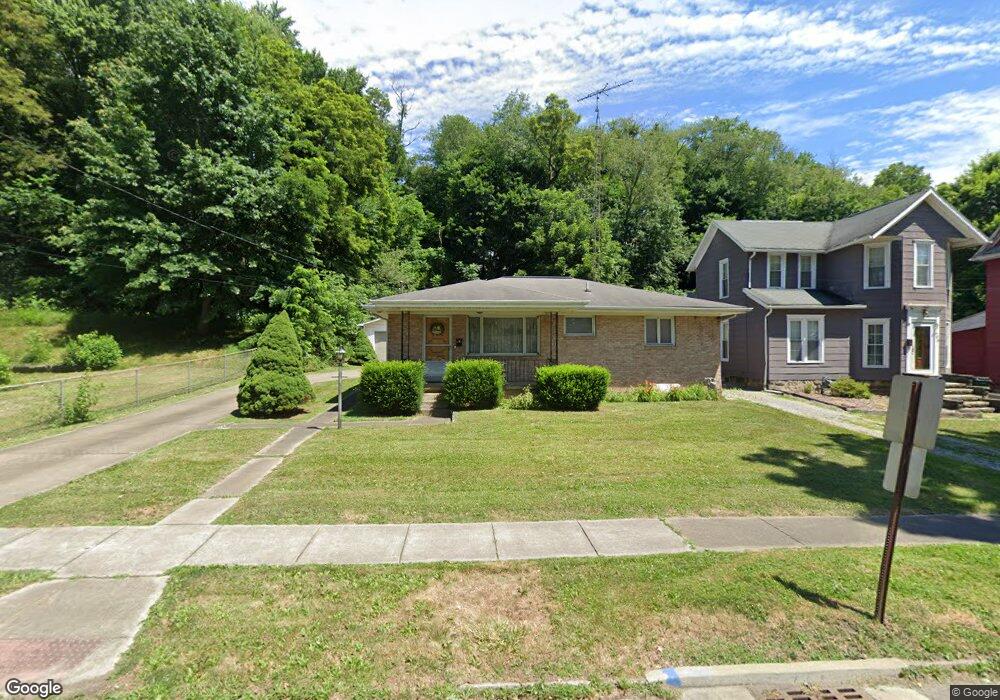
301 E Chestnut St Lisbon, OH 44432
Estimated Value: $102,000 - $126,708
2
Beds
1
Bath
1,064
Sq Ft
$107/Sq Ft
Est. Value
About This Home
This home is located at 301 E Chestnut St, Lisbon, OH 44432 and is currently estimated at $113,927, approximately $107 per square foot. 301 E Chestnut St is a home located in Columbiana County with nearby schools including McKinley Elementary School and David Anderson Junior/Senior High School.
Ownership History
Date
Name
Owned For
Owner Type
Purchase Details
Closed on
Jun 6, 2025
Sold by
Thorne Patch Llc
Bought by
Channels Nicholas
Current Estimated Value
Home Financials for this Owner
Home Financials are based on the most recent Mortgage that was taken out on this home.
Original Mortgage
$101,010
Outstanding Balance
$100,753
Interest Rate
6.86%
Mortgage Type
New Conventional
Estimated Equity
$13,174
Purchase Details
Closed on
Feb 19, 2025
Sold by
Thorne Bryant Jene M and Thorne Robert Lodge
Bought by
Thorne Patch Llc
Purchase Details
Closed on
Nov 3, 2020
Sold by
Thorne Jene M
Bought by
Thorne Robert L and Thorne Jene M
Purchase Details
Closed on
Jan 28, 1998
Sold by
Stelter Irene
Bought by
Thorne Jene M
Create a Home Valuation Report for This Property
The Home Valuation Report is an in-depth analysis detailing your home's value as well as a comparison with similar homes in the area
Home Values in the Area
Average Home Value in this Area
Purchase History
| Date | Buyer | Sale Price | Title Company |
|---|---|---|---|
| Channels Nicholas | $100,000 | None Listed On Document | |
| Channels Nicholas | $100,000 | None Listed On Document | |
| Thorne Patch Llc | -- | None Listed On Document | |
| Thorne Patch Llc | -- | None Listed On Document | |
| Thorne Robert L | -- | None Available | |
| Thorne Robert L | -- | None Listed On Document | |
| Thorne Jene M | -- | -- |
Source: Public Records
Mortgage History
| Date | Status | Borrower | Loan Amount |
|---|---|---|---|
| Open | Channels Nicholas | $101,010 | |
| Closed | Channels Nicholas | $101,010 |
Source: Public Records
Tax History
| Year | Tax Paid | Tax Assessment Tax Assessment Total Assessment is a certain percentage of the fair market value that is determined by local assessors to be the total taxable value of land and additions on the property. | Land | Improvement |
|---|---|---|---|---|
| 2025 | $1,339 | $39,070 | $7,880 | $31,190 |
| 2024 | $817 | $33,120 | $6,690 | $26,430 |
| 2023 | $839 | $33,120 | $6,690 | $26,430 |
| 2022 | $823 | $33,120 | $6,690 | $26,430 |
| 2021 | $697 | $28,490 | $5,670 | $22,820 |
| 2020 | $697 | $28,490 | $5,670 | $22,820 |
| 2019 | $697 | $28,490 | $5,670 | $22,820 |
| 2018 | $579 | $25,910 | $5,150 | $20,760 |
| 2017 | $579 | $25,910 | $5,150 | $20,760 |
| 2016 | $579 | $26,540 | $6,270 | $20,270 |
| 2015 | $658 | $26,540 | $6,270 | $20,270 |
| 2014 | $648 | $26,540 | $6,270 | $20,270 |
Source: Public Records
Map
Nearby Homes
- 306 E Chestnut St
- 236 N Market St
- 122 Harrison St
- 328-330 E Washington St
- 0 High St
- 402 E Lincoln Way
- 440 E Chestnut St
- 0 Fairground Rd Unit 5186487
- 226 Pritchard Ave
- 121 Jerome St
- 8695 Graham St
- 9 Prospect St
- 205 Graham St
- 8146 Pritchard Ave
- 218 S Lincoln Ave
- 431 W Lincoln Way
- 39030 Brookfield Ave
- 604 W Lincoln Way
- 929 N Market St
- 620 Thomas Rd
- 235 E Chestnut St
- 309 E Chestnut St
- 313 E Chestnut St
- 229 E Chestnut St
- 317 E Chestnut St
- 302 E Chestnut St
- 219 E Chestnut St
- 131 N Vine St
- 323 E Chestnut St
- 128 N Vine St
- 242 E High St
- 226 E Chestnut St
- 320 E Chestnut St Unit 2
- 320 E Chestnut St
- 230 E High St
- 329 E Chestnut St
- 124 N Vine St
- 127 N Vine St
- 213 E Chestnut St
- 220 E Chestnut St
Your Personal Tour Guide
Ask me questions while you tour the home.