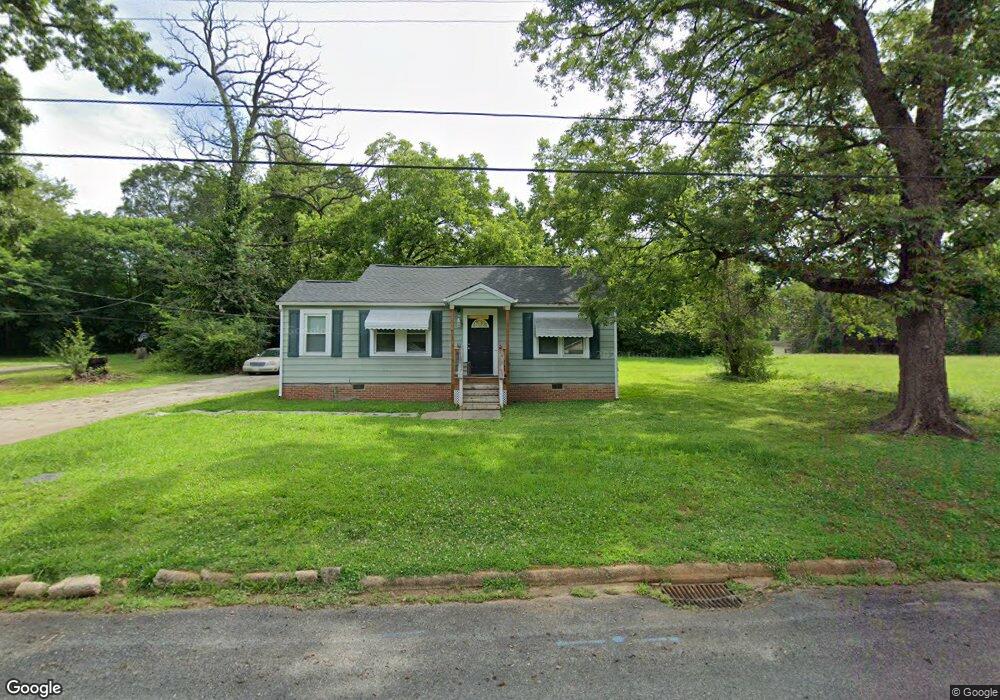
301 E Henderson Es St East Spencer, NC 28144
Estimated Value: $160,037 - $236,000
--
Bed
--
Bath
1,032
Sq Ft
$193/Sq Ft
Est. Value
About This Home
This home is located at 301 E Henderson Es St, East Spencer, NC 28144 and is currently estimated at $199,009, approximately $192 per square foot. 301 E Henderson Es St is a home with nearby schools including Carroll T Overton Elementary School, Knox Middle School, and North Rowan Middle School.
Ownership History
Date
Name
Owned For
Owner Type
Purchase Details
Closed on
Nov 29, 2018
Sold by
Lott James J and Lott Brenda K
Bought by
Agnes Oak Properties Llc
Current Estimated Value
Purchase Details
Closed on
Jan 23, 2013
Sold by
Lloyd Sheila D
Bought by
Lott James J and Lott Brenda K
Purchase Details
Closed on
Jan 5, 2011
Sold by
Boucher Andre J and Boucher Alice M
Bought by
Lloyd Sheila D
Purchase Details
Closed on
Jan 21, 2008
Sold by
Lloyd Sheila Dianne Allman
Bought by
Boucher Andre J and Boucher Alice M
Home Financials for this Owner
Home Financials are based on the most recent Mortgage that was taken out on this home.
Original Mortgage
$184,000
Interest Rate
5.94%
Mortgage Type
Seller Take Back
Create a Home Valuation Report for This Property
The Home Valuation Report is an in-depth analysis detailing your home's value as well as a comparison with similar homes in the area
Home Values in the Area
Average Home Value in this Area
Purchase History
| Date | Buyer | Sale Price | Title Company |
|---|---|---|---|
| Agnes Oak Properties Llc | $85,000 | None Available | |
| Lott James J | $3,000 | None Available | |
| Lloyd Sheila D | $85,000 | None Available | |
| Boucher Andre J | $184,000 | None Available |
Source: Public Records
Mortgage History
| Date | Status | Borrower | Loan Amount |
|---|---|---|---|
| Previous Owner | Boucher Andre J | $184,000 |
Source: Public Records
Tax History Compared to Growth
Tax History
| Year | Tax Paid | Tax Assessment Tax Assessment Total Assessment is a certain percentage of the fair market value that is determined by local assessors to be the total taxable value of land and additions on the property. | Land | Improvement |
|---|---|---|---|---|
| 2025 | $1,348 | $108,691 | $24,000 | $84,691 |
| 2024 | $1,348 | $108,691 | $24,000 | $84,691 |
| 2023 | $1,348 | $108,691 | $24,000 | $84,691 |
| 2022 | $680 | $51,586 | $15,000 | $36,586 |
| 2021 | $692 | $52,502 | $15,000 | $37,502 |
| 2020 | $692 | $52,502 | $15,000 | $37,502 |
| 2019 | $692 | $52,502 | $15,000 | $37,502 |
| 2018 | $581 | $44,621 | $15,000 | $29,621 |
| 2017 | $568 | $44,621 | $15,000 | $29,621 |
| 2016 | $568 | $44,621 | $15,000 | $29,621 |
| 2015 | $577 | $44,621 | $15,000 | $29,621 |
| 2014 | $587 | $45,837 | $15,000 | $30,837 |
Source: Public Records
Map
Nearby Homes
- 117 E Steele St
- 115 E Steele St
- 501 E Lafayette St
- 1713 N Clay St
- 113 E Miller St
- 505 E Cemetery St
- 208 W Lafayette St
- 1016 Scales St
- 1008 N Main St
- 628 E Lafayette St
- 1116 Bryce Ave
- 507 Park Ave
- 921 N Jackson St
- 1120 Crestview Ave
- 316 N Clay St
- 829 Green St
- 215 W 10th St
- 0 Brown St
- 223 W 11th St
- 1270 N Shaver St
- 305 E Henderson Es St
- 308 E Henderson St
- 318 E Henderson St
- 328 E Henderson St
- 0 E Henderson St
- 0 E Henderson St
- 730 N Railroad St
- 726 N Railroad St
- 800 N Railroad St
- 717 N Lee St
- 727 N Lee St
- 514 E Henderson St
- 731 N Lee St
- 812 N Railroad Ave
- 812 N Railroad St
- 812 N Railroad Ave Unit NULL
- 801 N Long St
- 408 E Henderson St
- 803 N Lee St
- 811 N Lee St