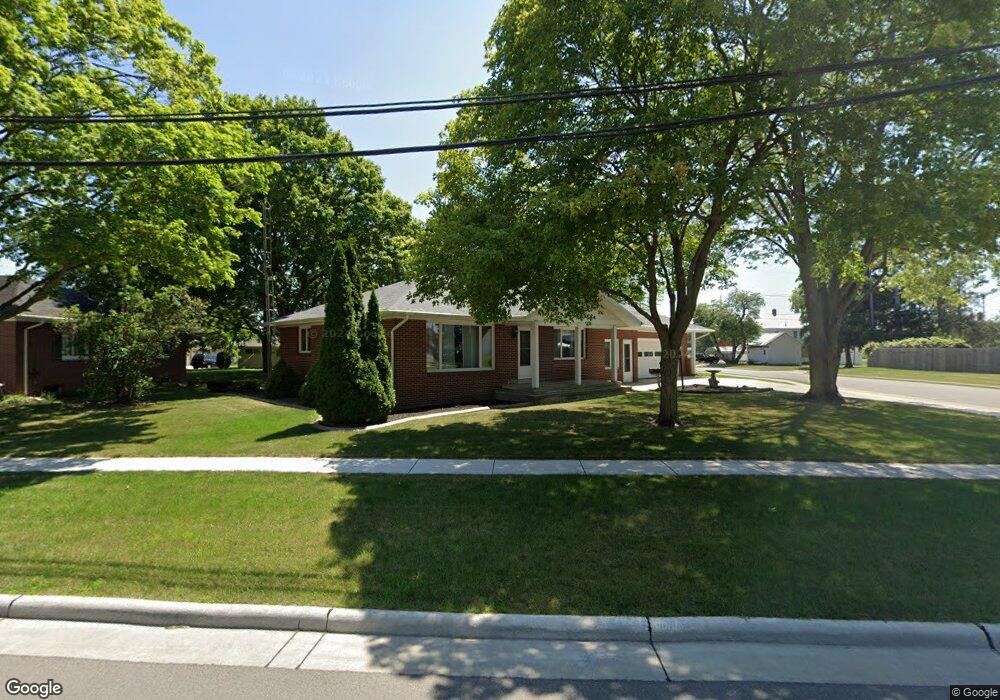
301 E Holland St Archbold, OH 43502
Estimated Value: $176,000 - $208,000
2
Beds
2
Baths
1,380
Sq Ft
$139/Sq Ft
Est. Value
About This Home
This home is located at 301 E Holland St, Archbold, OH 43502 and is currently estimated at $192,392, approximately $139 per square foot. 301 E Holland St is a home located in Fulton County with nearby schools including Archbold Elementary School, Archbold Middle School, and Archbold High School.
Ownership History
Date
Name
Owned For
Owner Type
Purchase Details
Closed on
Jun 14, 2007
Sold by
Fenicle Kristi and Fenicle James M
Bought by
Figgins Robert D
Current Estimated Value
Home Financials for this Owner
Home Financials are based on the most recent Mortgage that was taken out on this home.
Original Mortgage
$89,600
Interest Rate
6.2%
Mortgage Type
New Conventional
Purchase Details
Closed on
Jun 14, 2000
Sold by
Short Bonilynn
Bought by
Shade Kristi
Home Financials for this Owner
Home Financials are based on the most recent Mortgage that was taken out on this home.
Original Mortgage
$65,000
Interest Rate
8.31%
Mortgage Type
New Conventional
Purchase Details
Closed on
Jan 1, 1990
Bought by
Short Bonilynn
Create a Home Valuation Report for This Property
The Home Valuation Report is an in-depth analysis detailing your home's value as well as a comparison with similar homes in the area
Home Values in the Area
Average Home Value in this Area
Purchase History
| Date | Buyer | Sale Price | Title Company |
|---|---|---|---|
| Figgins Robert D | $112,000 | Attorney | |
| Shade Kristi | $100,000 | -- | |
| Short Bonilynn | -- | -- |
Source: Public Records
Mortgage History
| Date | Status | Borrower | Loan Amount |
|---|---|---|---|
| Closed | Figgins Robert D | $89,600 | |
| Previous Owner | Shade Kristi | $65,000 |
Source: Public Records
Tax History Compared to Growth
Tax History
| Year | Tax Paid | Tax Assessment Tax Assessment Total Assessment is a certain percentage of the fair market value that is determined by local assessors to be the total taxable value of land and additions on the property. | Land | Improvement |
|---|---|---|---|---|
| 2024 | $2,550 | $49,350 | $10,360 | $38,990 |
| 2023 | $2,550 | $49,350 | $10,360 | $38,990 |
| 2022 | $1,985 | $39,840 | $8,650 | $31,190 |
| 2021 | $1,987 | $39,840 | $8,650 | $31,190 |
| 2020 | $1,980 | $39,840 | $8,650 | $31,190 |
| 2019 | $1,822 | $34,970 | $8,650 | $26,320 |
| 2018 | $1,668 | $34,970 | $8,650 | $26,320 |
| 2017 | $1,621 | $34,970 | $8,650 | $26,320 |
| 2016 | $1,676 | $33,710 | $8,650 | $25,060 |
| 2015 | $1,474 | $33,710 | $8,650 | $25,060 |
| 2014 | $1,474 | $33,710 | $8,650 | $25,060 |
| 2013 | $1,671 | $34,690 | $7,420 | $27,270 |
Source: Public Records
Map
Nearby Homes
- 307 Middle St
- 804 Murbach St
- 813 Murbach St
- 404 Walnut St
- 301 N Pointe Dr
- 300 Degroff Ave
- 0 S Defiance St
- 200 Burke St
- 433 Primrose Ln
- 0 Lafayette St
- 552 Quail Run
- 112 Sylvanus St
- 24218 State Route 2
- 209 Hawthorn Dr
- 3063 County Road 26-2
- 7170 County Road 23
- 0 County Road F
- 352 German St
- 5445 County Road 19
- 22018 County Road F
- 309 E Holland St
- 214 E Holland St
- 212 E Holland St
- 311 E Holland St
- 311 E Holland St Unit C
- 205 E Holland St
- 205 E Holland St
- 206 Depot St
- 210 E Holland St
- 100 High St
- 204 Depot St
- 208 E Holland St
- 208 E Holland St
- 209 E Williams St
- 211 E Williams St
- 106 Vine St
- 205 Depot St
- 202 E Holland St
- 207 E Williams St
- 213 E Williams St