Estimated Value: $939,000 - $2,617,710
1
Bed
2
Baths
750
Sq Ft
$2,721/Sq Ft
Est. Value
About This Home
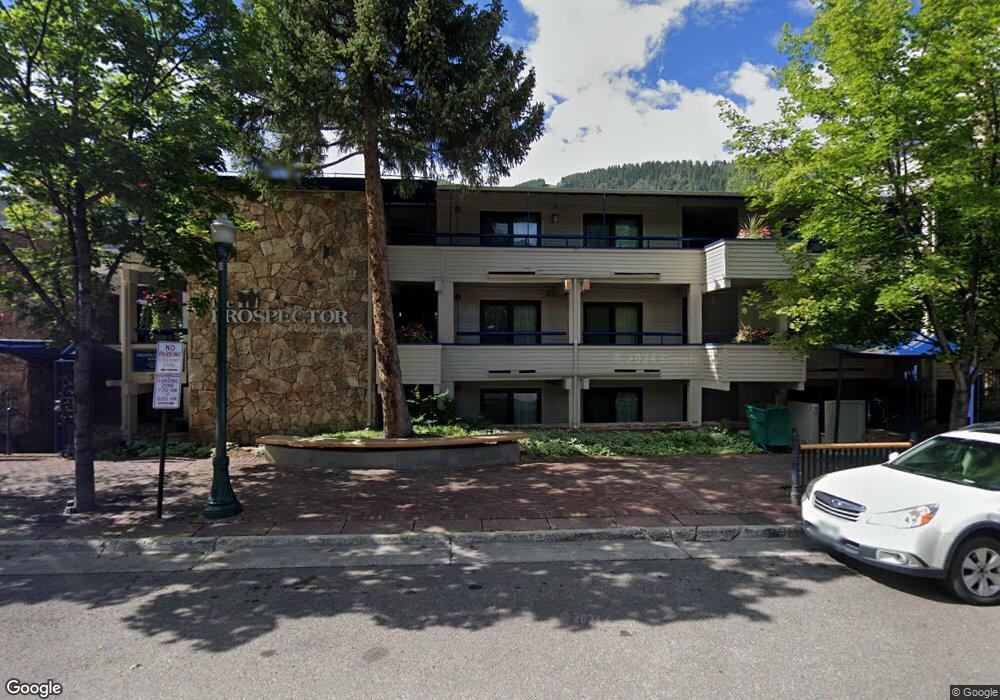
This home is located at 301 E Hyman Ave Unit 206, Aspen, CO 81611 and is currently estimated at $2,040,903, approximately $2,721 per square foot. 301 E Hyman Ave Unit 206 is a home located in Pitkin County with nearby schools including Aspen Elementary School, Aspen Middle School, and Aspen High School.
Ownership History
Date
Name
Owned For
Owner Type
Purchase Details
Closed on
Oct 1, 2025
Sold by
Mami Revocable Trust
Bought by
Dmcc Properties Llc
Current Estimated Value
Purchase Details
Closed on
Mar 3, 2022
Sold by
Joseph Kljngensmith
Bought by
301 Prospector Llc
Purchase Details
Closed on
Feb 21, 2022
Sold by
Prospector Condominiums
Bought by
Kungensmith Joseph and Klingensmith Georganna
Purchase Details
Closed on
Oct 29, 2021
Sold by
Southbrook Investments Inc
Bought by
Prospectors Fractional Owners Association
Purchase Details
Closed on
May 17, 2021
Sold by
Ehlers Jean W
Bought by
Ehlers Jean W and Close Jane E
Purchase Details
Closed on
Feb 4, 2021
Sold by
Close Jane E
Bought by
Ehlers Jean W
Purchase Details
Closed on
Jan 31, 2008
Sold by
Mujica Azita
Bought by
Lenz Edward
Purchase Details
Closed on
Jun 8, 2001
Sold by
Galluccio Vincent
Bought by
Allison Margaret
Create a Home Valuation Report for This Property
The Home Valuation Report is an in-depth analysis detailing your home's value as well as a comparison with similar homes in the area
Home Values in the Area
Average Home Value in this Area
Purchase History
| Date | Buyer | Sale Price | Title Company |
|---|---|---|---|
| Dmcc Properties Llc | $75,000 | Land Title | |
| 301 Prospector Llc | $17,500 | Land Title | |
| Klingensmith Joseph | -- | None Listed On Document | |
| Kungensmith Joseph | -- | None Listed On Document | |
| Prospectors Fractional Owners Association | -- | Ortern & Hindman Pc | |
| Ehlers Jean W | -- | None Available | |
| Ehlers Jean W | -- | None Available | |
| Lenz Edward | $56,000 | None Available | |
| Allison Margaret | $5,000 | Land Title Guarantee Company |
Source: Public Records
Tax History Compared to Growth
Tax History
| Year | Tax Paid | Tax Assessment Tax Assessment Total Assessment is a certain percentage of the fair market value that is determined by local assessors to be the total taxable value of land and additions on the property. | Land | Improvement |
|---|---|---|---|---|
| 2024 | $3,529 | $107,340 | $0 | $107,340 |
| 2023 | $3,529 | $111,090 | $0 | $111,090 |
| 2022 | $2,134 | $58,220 | $0 | $58,220 |
| 2021 | $2,125 | $59,900 | $0 | $59,900 |
| 2020 | $1,842 | $51,570 | $0 | $51,570 |
| 2019 | $1,842 | $51,570 | $0 | $51,570 |
| 2018 | $1,631 | $51,930 | $0 | $51,930 |
| 2017 | $1,439 | $51,720 | $0 | $51,720 |
| 2016 | $1,269 | $39,090 | $0 | $39,090 |
| 2015 | $1,253 | $39,090 | $0 | $39,090 |
| 2014 | $1,501 | $44,760 | $0 | $44,760 |
Source: Public Records
Map
Nearby Homes
- 301 E Hyman Ave Unit 106 (Wks. 3,33,47)
- 301 E Hyman Ave Unit 105 (Wks. 20,21,44)
- 301 E Hyman Ave Unit 207, Weeks 35,36,48
- 301 E Hyman Ave Unit 302 (Wks 20,35,47)
- 301 E Hyman Ave Unit 301 (Wks 3,4,47)
- 301 E Hyman Ave Unit 206 (Wks 14,23,39)
- 301 E Hyman Ave Unit 205 (Wks 5, 6 & 11)
- 301 E Hyman Ave Unit 204 (Wks 2,38,46)
- 301 E Hyman Ave Unit 102 (Wks. 20,21,39)
- 301 E Hyman Ave Unit 105 (Wks. 2,12,37)
- 301 E Hyman Ave Unit 203 (Wks 20,21,44)
- 301 E Hyman Ave Unit 104 (Wks. 21,22,38)
- 301 E Hyman Ave Unit 104 (Wks. 47,48,49)
- 210 E Cooper Ave Unit 3E
- 210 E Cooper Ave Unit 1C
- 210 E Cooper Ave Unit 3G
- 125 E Hyman Ave Unit 1
- 411 S Monarch St Unit C7
- 411 S Monarch St Unit H8
- 219 E Durant Ave Unit A11
- 301 E Hyman Ave Unit 304
- 301 E Hyman Ave Unit 207
- 301 E Hyman Ave Unit 305
- 301 E Hyman Ave Unit 303
- 301 E Hyman Ave Unit 302
- 301 E Hyman Ave Unit 301
- 301 E Hyman Ave Unit 208
- 301 E Hyman Ave Unit 205
- 301 E Hyman Ave Unit 204
- 301 E Hyman Ave Unit 203
- 301 E Hyman Ave Unit 201
- 301 E Hyman Ave Unit 108
- 301 E Hyman Ave Unit 106
- 301 E Hyman Ave Unit 105
- 301 E Hyman Ave Unit 104
- 301 E Hyman Ave Unit 103
- 301 E Hyman Ave Unit 102
- 301 E Hyman Ave Unit 101
- 301 E Hyman Ave Unit 101 (Wks. 8,9,10,11
- 301 E Hyman Ave Unit 302 (Weeks 34, 39,