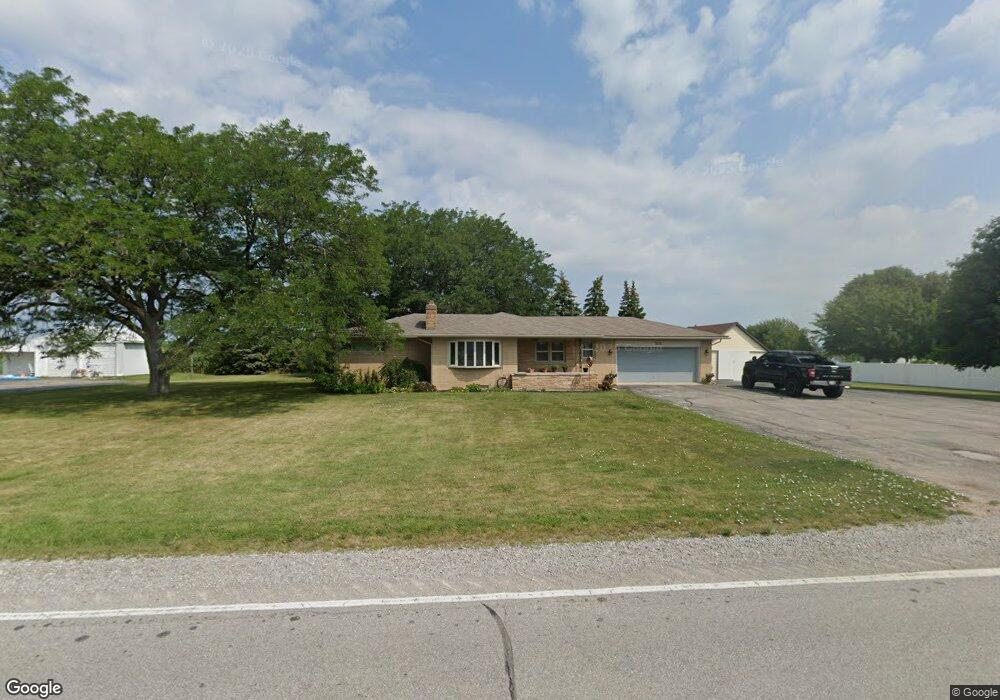
301 E Munger Rd Munger, MI 48747
Estimated Value: $144,000 - $225,000
4
Beds
2
Baths
1,359
Sq Ft
$140/Sq Ft
Est. Value
About This Home
This home is located at 301 E Munger Rd, Munger, MI 48747 and is currently estimated at $190,588, approximately $140 per square foot. 301 E Munger Rd is a home located in Bay County with nearby schools including Hampton Elementary School, Handy Middle School, and Bay City Central High School.
Ownership History
Date
Name
Owned For
Owner Type
Purchase Details
Closed on
Oct 3, 2011
Sold by
Kruchkow Samuel D and Kruchkow Dorene
Bought by
Kruchkow Samuel D and Kruchkow Dorene
Current Estimated Value
Home Financials for this Owner
Home Financials are based on the most recent Mortgage that was taken out on this home.
Original Mortgage
$103,500
Outstanding Balance
$71,032
Interest Rate
4.23%
Mortgage Type
New Conventional
Estimated Equity
$119,556
Purchase Details
Closed on
Jun 25, 2010
Sold by
Thompson Gary A
Bought by
Credit Union Plus
Purchase Details
Closed on
Jul 28, 2005
Sold by
Thompson Margaret A
Bought by
Thompson Gary A
Home Financials for this Owner
Home Financials are based on the most recent Mortgage that was taken out on this home.
Original Mortgage
$65,000
Interest Rate
5.71%
Mortgage Type
Fannie Mae Freddie Mac
Purchase Details
Closed on
May 23, 1997
Sold by
Kleinert Larry A and Kleinert Donna J
Bought by
Thompson Gary A and Thompson Margaret A
Create a Home Valuation Report for This Property
The Home Valuation Report is an in-depth analysis detailing your home's value as well as a comparison with similar homes in the area
Purchase History
| Date | Buyer | Sale Price | Title Company |
|---|---|---|---|
| Kruchkow Samuel D | -- | None Available | |
| Kruchlow Samuel D | $100,000 | None Available | |
| Credit Union Plus | $18,554 | None Available | |
| Thompson Gary A | -- | Fatic | |
| Thompson Gary A | $97,000 | -- |
Source: Public Records
Mortgage History
| Date | Status | Borrower | Loan Amount |
|---|---|---|---|
| Open | Kruchlow Samuel D | $103,500 | |
| Previous Owner | Thompson Gary A | $65,000 |
Source: Public Records
Tax History
| Year | Tax Paid | Tax Assessment Tax Assessment Total Assessment is a certain percentage of the fair market value that is determined by local assessors to be the total taxable value of land and additions on the property. | Land | Improvement |
|---|---|---|---|---|
| 2025 | $911 | $91,450 | $0 | $0 |
| 2024 | $885 | $80,600 | $0 | $0 |
| 2023 | $1,810 | $67,850 | $0 | $0 |
| 2022 | $1,728 | $67,050 | $0 | $0 |
| 2021 | $1,592 | $61,000 | $61,000 | $0 |
| 2020 | $1,557 | $45,700 | $45,700 | $0 |
| 2019 | $1,534 | $44,750 | $0 | $0 |
| 2018 | $1,511 | $44,350 | $0 | $0 |
| 2017 | $1,575 | $46,650 | $0 | $0 |
| 2016 | $1,661 | $49,600 | $10,500 | $39,100 |
| 2015 | -- | $48,850 | $10,500 | $38,350 |
| 2014 | -- | $50,900 | $8,400 | $42,500 |
Source: Public Records
Map
Nearby Homes
- 2055 S Farley Rd
- 2239 S Tuscola Rd
- 1245 S Pine Rd
- 0 W Munger Rd
- 3705 N Beyer Rd
- 1829 Bullock Rd
- 513 W Ridge Rd
- E E Center Rd
- 618 N Jones Rd
- 743 N Jones Rd
- 568 W Center Rd
- 1083 S Van Buren Rd
- 0 E Nebobish Rd
- 811 SE Boutell Rd
- 1870 Morin Dr
- 0 Eastland Dr
- 197 N Cotter Rd
- 2575 N Block Rd
- 12895 E Washington Rd
- 9996 North St
- 285 E Munger Rd
- 321 E Munger Rd
- 298 E Munger Rd
- 276 E Munger Rd
- 275 E Munger Rd
- 259 E Munger Rd
- 251 E Munger Rd
- 256 E Munger Rd
- 348 E Munger Rd
- 245 E Munger Rd
- 216 E Munger Rd
- 359 E Munger Rd
- 194 E Munger Rd
- 424 E Munger Rd
- 424 E Munger Rd
- 189 E Munger Rd
- 200 E Munger Rd
- 183 E Munger Rd
- 1479 Birch St
- 1461 Birch St
Your Personal Tour Guide
Ask me questions while you tour the home.