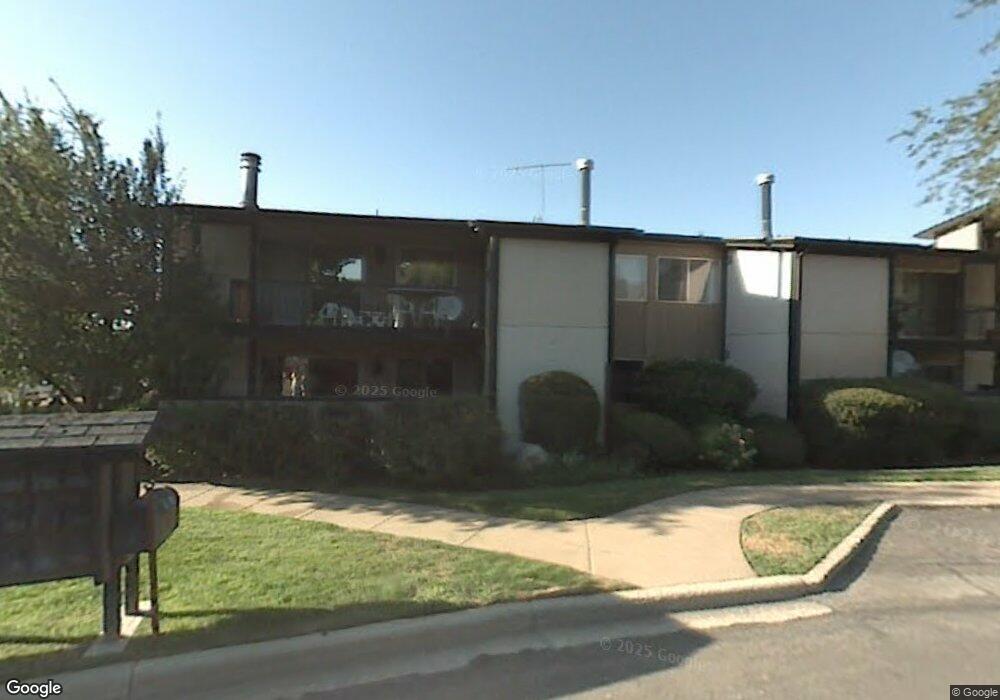
301 E Peach Ln Bountiful, UT 84010
Estimated Value: $285,000 - $303,000
2
Beds
2
Baths
1,148
Sq Ft
$256/Sq Ft
Est. Value
About This Home
This home is located at 301 E Peach Ln, Bountiful, UT 84010 and is currently estimated at $293,333, approximately $255 per square foot. 301 E Peach Ln is a home located in Davis County with nearby schools including Valley View School, Millcreek Junior High School, and Bountiful High School.
Ownership History
Date
Name
Owned For
Owner Type
Purchase Details
Closed on
Jul 11, 2022
Sold by
Stokes Chyree A
Bought by
Stokes Chyree A and Stokes Taylor Rylee
Current Estimated Value
Purchase Details
Closed on
Aug 26, 2014
Sold by
Martin Lynne and Creviston Todd
Bought by
Stokes Chyree A
Purchase Details
Closed on
Jun 10, 2013
Sold by
Gneiting Norma
Bought by
Gneiting Norma and The Norma Ann Gneiting Living Trust
Purchase Details
Closed on
Aug 28, 1997
Sold by
Lefler Thomas and Lefler Laura E
Bought by
Gnetting Norma
Create a Home Valuation Report for This Property
The Home Valuation Report is an in-depth analysis detailing your home's value as well as a comparison with similar homes in the area
Purchase History
| Date | Buyer | Sale Price | Title Company |
|---|---|---|---|
| Stokes Chyree A | -- | Stewart Title | |
| Stokes Chyree A | -- | Title Guarantee | |
| Gneiting Norma | -- | None Available | |
| Gnetting Norma | -- | Associated Title Company |
Source: Public Records
Tax History
| Year | Tax Paid | Tax Assessment Tax Assessment Total Assessment is a certain percentage of the fair market value that is determined by local assessors to be the total taxable value of land and additions on the property. | Land | Improvement |
|---|---|---|---|---|
| 2025 | $1,594 | $148,500 | $48,950 | $99,550 |
| 2024 | $1,534 | $145,750 | $54,450 | $91,300 |
| 2023 | $1,512 | $261,000 | $93,000 | $168,000 |
| 2022 | $1,539 | $145,750 | $32,450 | $113,300 |
| 2021 | $1,483 | $215,000 | $46,000 | $169,000 |
| 2020 | $385 | $188,000 | $42,600 | $145,400 |
| 2019 | $1,222 | $173,000 | $39,000 | $134,000 |
| 2018 | $1,108 | $154,000 | $36,000 | $118,000 |
| 2016 | $902 | $67,540 | $12,925 | $54,615 |
| 2015 | $834 | $58,685 | $12,925 | $45,760 |
| 2014 | $806 | $58,276 | $18,333 | $39,943 |
| 2013 | -- | $68,341 | $16,775 | $51,566 |
Source: Public Records
Map
Nearby Homes
- 323 Peach Ln
- 275 E Peach Ln S
- 456 E 500 S
- 255 E 400 S
- 545 S 100 E
- 357 S 100 E
- 1195 S Orchard Dr
- 650 S Main St Unit 7107
- 650 S Main St Unit 6206
- 650 S Main St Unit 4104
- 650 S Main St Unit 9106
- 34 W 400 S
- 32 W 400 S
- 698 E 200 S
- 380 E 1500 S
- 861 E Millbrook Way
- 683 E 100 N
- 795 Abby Ln Unit 5
- 6 N 800 E
- 55 E 200 N Unit 2
- 305 Peach Ln
- 305 Peach Ln Unit G
- 301 Peach Ln
- 311 Peach Ln
- 303 Peach Ln
- 307 Peach Ln Unit H
- 307 Peach Ln Unit B
- 315 E Peach Ln
- 315 Peach Ln
- 313 Peach Ln
- 309 Peach Ln
- 309 E Peach Ln
- 319 Peach Ln
- 323 Peach Ln Unit H
- 345 Peach Ln
- 347 Peach Ln
- 325 Peach Ln
- 329 E Peach Ln S Unit C E-2
- 339 Peach Ln
- 329 Peach Ln Unit C
Your Personal Tour Guide
Ask me questions while you tour the home.