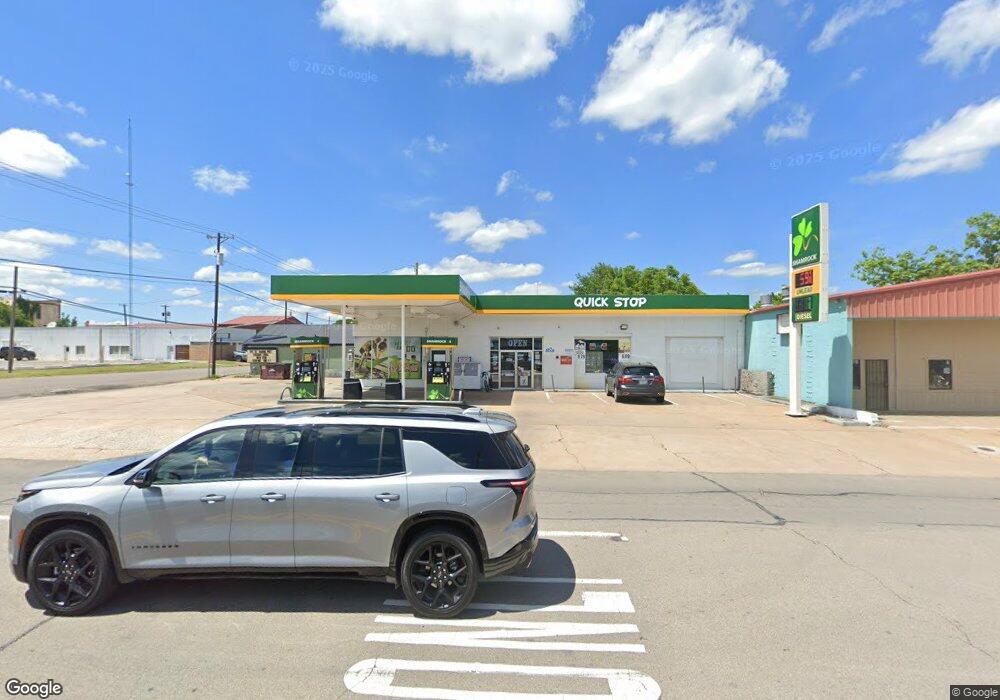
301 E Sam Rayburn Dr Bonham, TX 75418
Estimated Value: $679,757
Studio
--
Bath
2,380
Sq Ft
$286/Sq Ft
Est. Value
About This Home
This home is located at 301 E Sam Rayburn Dr, Bonham, TX 75418 and is currently priced at $679,757, approximately $285 per square foot. 301 E Sam Rayburn Dr is a home located in Fannin County with nearby schools including Evans Elementary School, Finley-Oates Elementary School, and LH Rather Jr High School.
Ownership History
Date
Name
Owned For
Owner Type
Purchase Details
Closed on
Aug 24, 2023
Sold by
C & J Brothers Llc
Bought by
Yc Multi Trade Llc
Current Estimated Value
Home Financials for this Owner
Home Financials are based on the most recent Mortgage that was taken out on this home.
Original Mortgage
$378,327
Outstanding Balance
$285,259
Interest Rate
6.96%
Mortgage Type
Seller Take Back
Purchase Details
Closed on
Oct 31, 2014
Sold by
Rostamza Massud M
Bought by
Ramadevi Investment Group Llc
Home Financials for this Owner
Home Financials are based on the most recent Mortgage that was taken out on this home.
Original Mortgage
$212,000
Interest Rate
4.21%
Mortgage Type
Commercial
Create a Home Valuation Report for This Property
The Home Valuation Report is an in-depth analysis detailing your home's value as well as a comparison with similar homes in the area
Purchase History
| Date | Buyer | Sale Price | Title Company |
|---|---|---|---|
| Yc Multi Trade Llc | -- | Main Street Title | |
| Ramadevi Investment Group Llc | -- | Cole Title Company |
Source: Public Records
Mortgage History
| Date | Status | Borrower | Loan Amount |
|---|---|---|---|
| Open | Yc Multi Trade Llc | $378,327 | |
| Previous Owner | Ramadevi Investment Group Llc | $212,000 |
Source: Public Records
Tax History
| Year | Tax Paid | Tax Assessment Tax Assessment Total Assessment is a certain percentage of the fair market value that is determined by local assessors to be the total taxable value of land and additions on the property. | Land | Improvement |
|---|---|---|---|---|
| 2025 | $7,400 | $381,520 | $60,780 | $320,740 |
| 2024 | $7,439 | $383,530 | $46,460 | $337,070 |
| 2023 | $5,818 | $295,040 | $43,640 | $251,400 |
| 2022 | $5,673 | $257,930 | $43,640 | $214,290 |
| 2021 | $3,278 | $129,700 | $26,250 | $103,450 |
| 2020 | $2,843 | $111,240 | $17,390 | $93,850 |
| 2019 | $3,306 | $124,400 | $17,390 | $107,010 |
| 2018 | $2,759 | $103,950 | $10,380 | $93,570 |
| 2017 | $2,289 | $89,550 | $9,840 | $79,710 |
| 2016 | $2,547 | $99,670 | $9,460 | $90,210 |
| 2015 | -- | $102,760 | $9,240 | $93,520 |
| 2014 | -- | $74,960 | $9,240 | $65,720 |
Source: Public Records
Map
Nearby Homes
- 420 E 5th St
- 520 E 5th St
- 410 E 6th St
- 514 E 5th St
- LOT 2 TBD County Road 2005
- TBD W Fm 274
- TBD LOT 1 County Road 2005
- tbd lot 3 County Road 2005
- 202 Pine St
- 611 Chestnut St
- 102 Elm St
- 314 E 2nd St
- 700 E 6th St
- 716 E 5th St
- 306 E 2nd St
- 814 Chestnut St
- 816 E 6th St
- 808 E 6th St
- 621 E 8th St
- 820 E 6th St
- 301 E Sam Rayburn Dr Unit B
- 301 E Sam Rayburn (B) Dr
- 303 E Sam Rayburn Dr
- 403 Cherry St
- 304 E 5th St
- 300 E 5th St
- 308 E 5th St
- 310 E 5th St
- 322 E 5th St
- 310 Chestnut St
- 316 E Sam Rayburn Dr
- 418 Cherry St
- 210 E 5th St
- 406 N Center St
- 400 N Center St
- 402 N Center St
- 408 N Center St
- 400 E 5th St
- 410 N Center St
- 309 Cherry St
Your Personal Tour Guide
Ask me questions while you tour the home.