2
Seller's Agent in 2014
240 Broker240
Coldwell Banker Commercial Dev


Estimated Value: $106,864
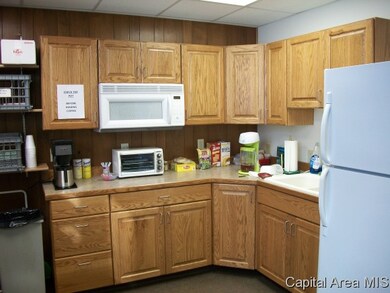
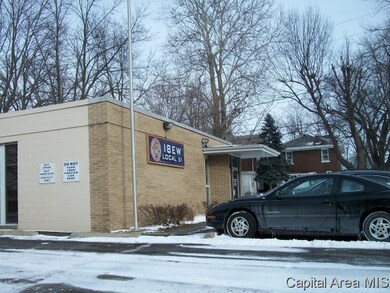
Property currently owned/occupied by IBEW Local 51. Well built and maintained building with several offices, conference room and meeting hall. 4,000 total square feet. Building wonât be available until late spring. Perhaps 1 June.
Last Agent to Sell the Property
240 Broker240
Coldwell Banker Commercial Dev Listed on: 01/21/2014
Last Buyer's Agent
JIM PETERS
IN BETWEEN OFFICES License #475100433
Property Type
Other
Lot Details
0.39 Acres
| Date | Buyer | Sale Price | Title Company |
|---|---|---|---|
| -- | $70,000 | -- |
| Date | Event | Price | List to Sale | Price per Sq Ft |
|---|---|---|---|---|
| 08/13/2014 08/13/14 | Sold | $70,000 | -27.0% | $18 / Sq Ft |
| 06/10/2014 06/10/14 | Pending | -- | -- | -- |
| 01/21/2014 01/21/14 | For Sale | $95,900 | -- | $24 / Sq Ft |
| Year | Tax Paid | Tax Assessment Tax Assessment Total Assessment is a certain percentage of the fair market value that is determined by local assessors to be the total taxable value of land and additions on the property. | Land | Improvement |
|---|---|---|---|---|
| 2024 | -- | $0 | $0 | $0 |
| 2023 | -- | $0 | $0 | $0 |
| 2022 | $0 | $0 | $0 | $0 |
| 2021 | $2,122 | $23,571 | $15,768 | $7,803 |
| 2020 | $2,080 | $23,607 | $15,792 | $7,815 |
| 2019 | $2,041 | $23,525 | $15,737 | $7,788 |
| 2018 | $2,065 | $24,436 | $15,670 | $8,766 |
| 2017 | $2,022 | $24,120 | $15,467 | $8,653 |
| 2016 | $1,982 | $23,768 | $15,241 | $8,527 |
| 2015 | $1,963 | $23,484 | $15,059 | $8,425 |
| 2014 | $1,934 | $23,333 | $14,962 | $8,371 |
| 2013 | $5,097 | $62,914 | $14,962 | $47,952 |
2
Seller's Agent in 2014
240 Broker240
Coldwell Banker Commercial Dev
J
Buyer's Agent in 2014
JIM PETERS
IN BETWEEN OFFICES
Source: RMLS Alliance
MLS Number: RMACA140261
APN: 22-04.0-233-005
Disclaimer: Certain information contained herein is derived from information provided by parties other than Homes.com. All information provided is deemed reliable, but is not guaranteed to be accurate and should be independently verified.
![]() Based on information submitted to the MLS GRID. All data is obtained from various sources and may not have been verified by broker or MLS GRID. Supplied Open House Information is subject to change without notice. All information should be independently reviewed and verified for accuracy. Properties may or may not be listed by the office/agent presenting the information. Some IDX listings have been excluded from this website.IDX information is provided exclusively for personal, non-commercial use, and may not be used for any purpose other than to identify prospective properties consumers may be interested in purchasing. Information is deemed reliable but not guaranteed.
Based on information submitted to the MLS GRID. All data is obtained from various sources and may not have been verified by broker or MLS GRID. Supplied Open House Information is subject to change without notice. All information should be independently reviewed and verified for accuracy. Properties may or may not be listed by the office/agent presenting the information. Some IDX listings have been excluded from this website.IDX information is provided exclusively for personal, non-commercial use, and may not be used for any purpose other than to identify prospective properties consumers may be interested in purchasing. Information is deemed reliable but not guaranteed.
Based on information submitted to the MLS GRID
Ask me questions while you tour the home.