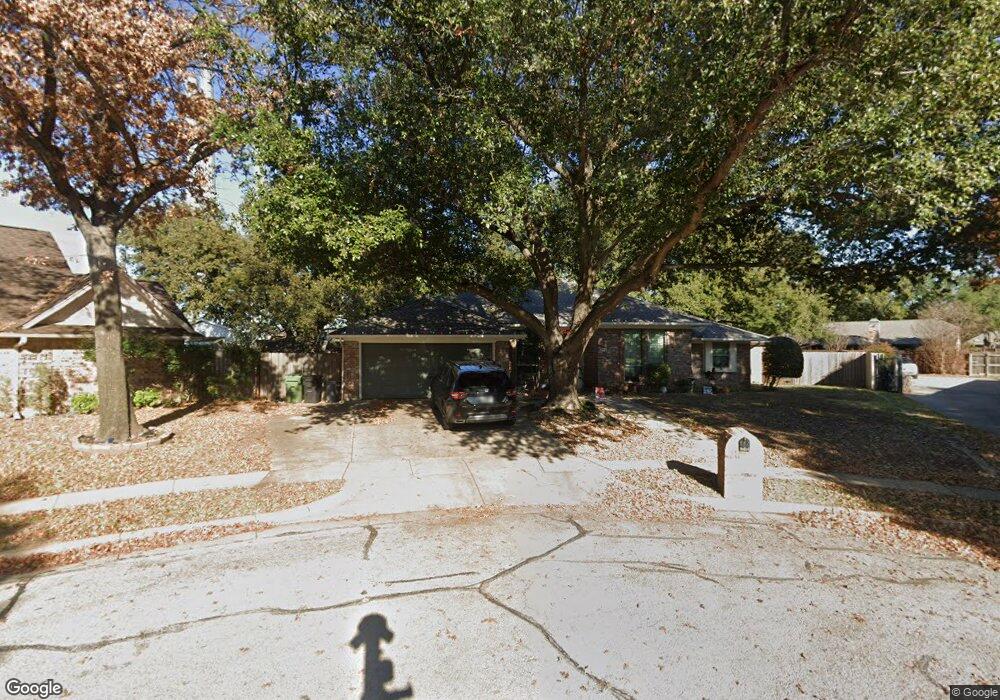
301 Elisha Ct Bedford, TX 76021
Estimated Value: $442,000 - $481,000
4
Beds
2
Baths
2,512
Sq Ft
$184/Sq Ft
Est. Value
About This Home
This home is located at 301 Elisha Ct, Bedford, TX 76021 and is currently estimated at $461,047, approximately $183 per square foot. 301 Elisha Ct is a home located in Tarrant County with nearby schools including Shady Oaks Elementary School, Bedford Junior High School, and L.D. Bell High School.
Ownership History
Date
Name
Owned For
Owner Type
Purchase Details
Closed on
Dec 18, 2019
Sold by
Walsingham Robert
Bought by
Walsingham Carrie
Current Estimated Value
Home Financials for this Owner
Home Financials are based on the most recent Mortgage that was taken out on this home.
Original Mortgage
$187,150
Outstanding Balance
$165,000
Interest Rate
3.6%
Mortgage Type
New Conventional
Estimated Equity
$296,047
Purchase Details
Closed on
Jun 16, 2005
Sold by
Voskuil David J and Voskuil Helle D
Bought by
Walsingham Robert W and Haller Carrie E
Home Financials for this Owner
Home Financials are based on the most recent Mortgage that was taken out on this home.
Original Mortgage
$157,600
Interest Rate
5.76%
Mortgage Type
Fannie Mae Freddie Mac
Create a Home Valuation Report for This Property
The Home Valuation Report is an in-depth analysis detailing your home's value as well as a comparison with similar homes in the area
Home Values in the Area
Average Home Value in this Area
Purchase History
| Date | Buyer | Sale Price | Title Company |
|---|---|---|---|
| Walsingham Carrie | -- | None Available | |
| Walsingham Robert W | -- | Rattikin Title |
Source: Public Records
Mortgage History
| Date | Status | Borrower | Loan Amount |
|---|---|---|---|
| Open | Walsingham Carrie | $187,150 | |
| Closed | Walsingham Robert W | $157,600 |
Source: Public Records
Tax History Compared to Growth
Tax History
| Year | Tax Paid | Tax Assessment Tax Assessment Total Assessment is a certain percentage of the fair market value that is determined by local assessors to be the total taxable value of land and additions on the property. | Land | Improvement |
|---|---|---|---|---|
| 2025 | $6,964 | $400,000 | $75,000 | $325,000 |
| 2024 | $6,964 | $430,071 | $75,000 | $355,071 |
| 2023 | $7,436 | $398,163 | $55,000 | $343,163 |
| 2022 | $7,698 | $373,334 | $55,000 | $318,334 |
| 2021 | $7,547 | $320,398 | $55,000 | $265,398 |
| 2020 | $7,144 | $300,468 | $55,000 | $245,468 |
| 2019 | $6,648 | $323,016 | $55,000 | $268,016 |
| 2018 | $5,661 | $248,764 | $55,000 | $193,764 |
| 2017 | $5,471 | $258,748 | $40,000 | $218,748 |
| 2016 | $4,974 | $223,600 | $40,000 | $183,600 |
| 2015 | $4,419 | $186,900 | $15,300 | $171,600 |
| 2014 | $4,419 | $186,900 | $15,300 | $171,600 |
Source: Public Records
Map
Nearby Homes
- 432 Sunnybrook Ct
- 121 Kay Ct
- 124 Jeannie Ct
- 1732 Jeannie Ln
- 1740 Brown Trail
- 100 Hillview Ct
- 817 Shady Lake Dr
- 2436 Brookgreen Ct
- 320 Blue Quail Ct
- 440 W Louella Dr
- 421 Cavender Ct
- 2420 Stonegate Dr N
- 801 Shady Creek Ln
- 229 Brookview Dr
- 3119 Spring Grove Dr
- 3213 Spring Valley Dr
- 305 Warbler Dr
- 922 Shady Creek Ln
- 113 Sunnyvale Terrace
- 520 Baker Dr