Estimated Value: $85,618 - $117,000
4
Beds
1
Bath
1,540
Sq Ft
$67/Sq Ft
Est. Value
About This Home
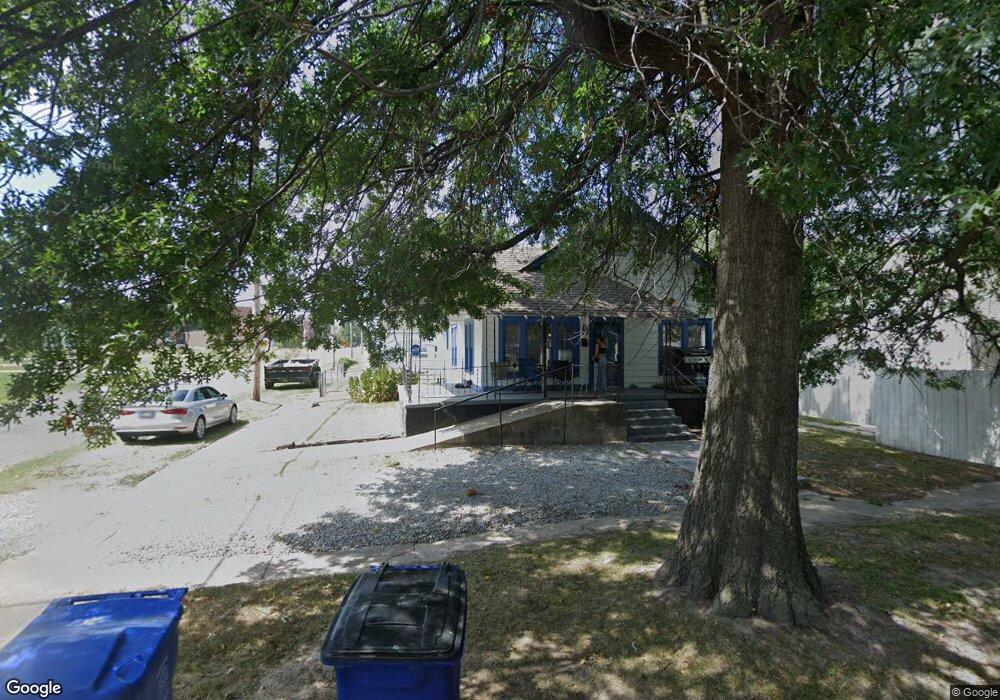
This home is located at 301 F St NE, Miami, OK 74354 and is currently estimated at $102,655, approximately $66 per square foot. 301 F St NE is a home located in Ottawa County with nearby schools including Miami High School and Mt. Olive Lutheran School.
Ownership History
Date
Name
Owned For
Owner Type
Purchase Details
Closed on
Sep 7, 2016
Sold by
Blevins George William and Blevins Viriginia
Bought by
Laub Patricia J and The Patricia J Laub Revocable Trust
Current Estimated Value
Home Financials for this Owner
Home Financials are based on the most recent Mortgage that was taken out on this home.
Original Mortgage
$15,381
Outstanding Balance
$12,272
Interest Rate
3.48%
Mortgage Type
Purchase Money Mortgage
Estimated Equity
$90,383
Purchase Details
Closed on
May 1, 2008
Sold by
Blevins George William and Blevins Virginia Lee
Bought by
Blevins George William and Blevins Virginia Lee
Create a Home Valuation Report for This Property
The Home Valuation Report is an in-depth analysis detailing your home's value as well as a comparison with similar homes in the area
Home Values in the Area
Average Home Value in this Area
Purchase History
| Date | Buyer | Sale Price | Title Company |
|---|---|---|---|
| Laub Patricia J | $26,500 | Ottawa County Abstract & Tit | |
| Blevins George William | -- | None Available |
Source: Public Records
Mortgage History
| Date | Status | Borrower | Loan Amount |
|---|---|---|---|
| Open | Laub Patricia J | $15,381 |
Source: Public Records
Tax History Compared to Growth
Tax History
| Year | Tax Paid | Tax Assessment Tax Assessment Total Assessment is a certain percentage of the fair market value that is determined by local assessors to be the total taxable value of land and additions on the property. | Land | Improvement |
|---|---|---|---|---|
| 2025 | $640 | $6,967 | $228 | $6,739 |
| 2024 | $640 | $6,635 | $228 | $6,407 |
| 2023 | $640 | $6,319 | $228 | $6,091 |
| 2022 | $556 | $6,019 | $228 | $5,791 |
| 2021 | $542 | $5,732 | $228 | $5,504 |
| 2020 | $520 | $5,459 | $228 | $5,231 |
| 2019 | $427 | $5,199 | $228 | $4,971 |
| 2018 | $430 | $5,199 | $228 | $4,971 |
| 2017 | $437 | $5,199 | $228 | $4,971 |
| 2016 | $250 | $3,117 | $192 | $2,925 |
| 2015 | $157 | $1,769 | $286 | $1,483 |
| 2014 | $243 | $2,969 | $148 | $2,821 |
Source: Public Records
Map
Nearby Homes