Estimated Value: $325,000 - $357,000
3
Beds
2
Baths
1,588
Sq Ft
$216/Sq Ft
Est. Value
About This Home
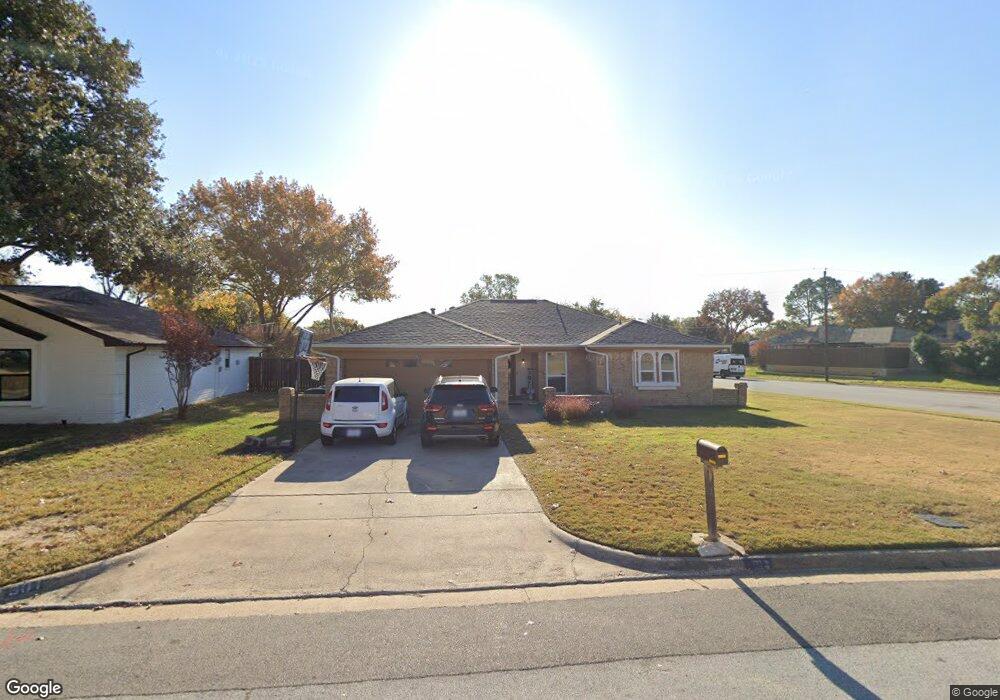
This home is located at 301 Fairhaven Ct, Hurst, TX 76054 and is currently estimated at $342,261, approximately $215 per square foot. 301 Fairhaven Ct is a home located in Tarrant County with nearby schools including Bedford Heights Elementary School, Bedford Junior High School, and L.D. Bell High School.
Ownership History
Date
Name
Owned For
Owner Type
Purchase Details
Closed on
Oct 22, 2025
Sold by
Capewest Series Llc-Series A Capewest Me
Bought by
Speck Caitlin Frances and Speck Heath Cole
Current Estimated Value
Home Financials for this Owner
Home Financials are based on the most recent Mortgage that was taken out on this home.
Original Mortgage
$251,250
Outstanding Balance
$251,250
Interest Rate
6.35%
Mortgage Type
New Conventional
Estimated Equity
$91,011
Purchase Details
Closed on
Dec 11, 2023
Sold by
Speck Heath and Speck Caitlin Frances
Bought by
Capewest Series Llc-Series A Capewest Metro
Purchase Details
Closed on
Nov 13, 2009
Sold by
Naughton Charles and Naughton Debra
Bought by
Speck Caitlin F and Speck Heath C
Home Financials for this Owner
Home Financials are based on the most recent Mortgage that was taken out on this home.
Original Mortgage
$127,645
Interest Rate
4.93%
Mortgage Type
FHA
Create a Home Valuation Report for This Property
The Home Valuation Report is an in-depth analysis detailing your home's value as well as a comparison with similar homes in the area
Home Values in the Area
Average Home Value in this Area
Purchase History
| Date | Buyer | Sale Price | Title Company |
|---|---|---|---|
| Speck Caitlin Frances | -- | Chicago Title | |
| Capewest Series Llc-Series A Capewest Metro | -- | None Listed On Document | |
| Speck Caitlin F | -- | Alamo Title Co |
Source: Public Records
Mortgage History
| Date | Status | Borrower | Loan Amount |
|---|---|---|---|
| Open | Speck Caitlin Frances | $251,250 | |
| Previous Owner | Speck Caitlin F | $127,645 |
Source: Public Records
Tax History Compared to Growth
Tax History
| Year | Tax Paid | Tax Assessment Tax Assessment Total Assessment is a certain percentage of the fair market value that is determined by local assessors to be the total taxable value of land and additions on the property. | Land | Improvement |
|---|---|---|---|---|
| 2025 | $6,090 | $298,175 | $75,000 | $223,175 |
| 2024 | $6,090 | $298,175 | $75,000 | $223,175 |
| 2023 | $5,936 | $296,306 | $55,000 | $241,306 |
| 2022 | $6,075 | $263,860 | $55,000 | $208,860 |
| 2021 | $5,708 | $238,156 | $55,000 | $183,156 |
| 2020 | $5,177 | $218,454 | $55,000 | $163,454 |
| 2019 | $4,787 | $220,000 | $55,000 | $165,000 |
| 2018 | $3,764 | $177,822 | $55,000 | $122,822 |
| 2017 | $4,091 | $171,482 | $18,000 | $153,482 |
| 2016 | $3,719 | $160,544 | $18,000 | $142,544 |
| 2015 | $3,067 | $133,600 | $18,000 | $115,600 |
| 2014 | $3,067 | $133,600 | $18,000 | $115,600 |
Source: Public Records
Map
Nearby Homes
- 421 Cavender Ct
- 404 Heather Ln
- 2212 Hurstview Dr
- 2244 Hurstview Dr
- 320 Blue Quail Ct
- 305 Warbler Dr
- 432 Sunnybrook Ct
- 440 W Louella Dr
- 121 Kay Ct
- 124 Jeannie Ct
- 2620 Brookridge Dr
- 520 Baker Dr
- 3713 Brentwood Ct
- 1732 Jeannie Ln
- 2668 Bent Tree Dr
- 405 Woodbriar Ct
- 100 Hillview Ct
- 425 W Pleasantview Dr
- 2732 Woodbridge Dr
- 712 Springwood Dr
- 305 Fairhaven Ct
- 2112 Norwood Dr
- 300 Fairhaven Ct
- 2108 Norwood Dr
- 309 Fairhaven Ct
- 401 Fairhaven Dr
- 300 Concord Dr
- 304 Fairhaven Ct
- 304 Concord Dr
- 400 Fairhaven Dr
- 2104 Norwood Dr
- 313 Fairhaven Ct
- 2124 Norwood Dr
- 2109 Cannon Dr
- 405 Fairhaven Dr
- 2113 Cannon Dr
- 308 Concord Dr
- 2117 Cannon Dr
- 308 Fairhaven Ct
- 301 Concord Dr