301 Greenview Ct Cedartown, GA 30125
Estimated Value: $237,103 - $256,000
3
Beds
2
Baths
1,760
Sq Ft
$141/Sq Ft
Est. Value
About This Home
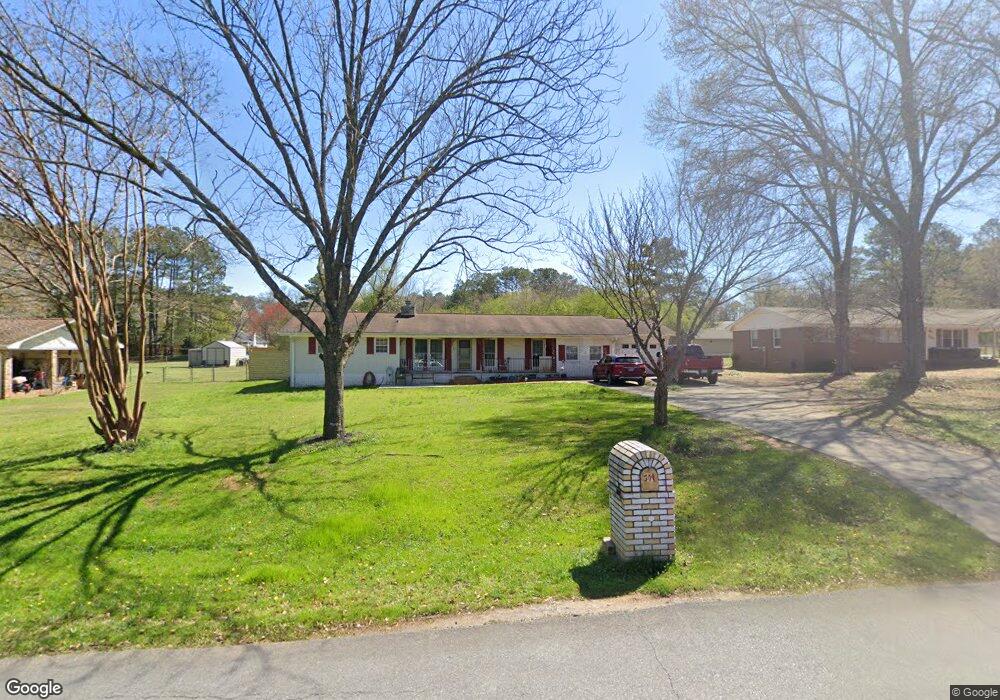
This home is located at 301 Greenview Ct, Cedartown, GA 30125 and is currently estimated at $248,776, approximately $141 per square foot. 301 Greenview Ct is a home located in Polk County with nearby schools including Cedar Christian School.
Ownership History
Date
Name
Owned For
Owner Type
Purchase Details
Closed on
Jan 27, 2015
Sold by
Marangakis Anastasio
Bought by
Marangakis Evangelia
Current Estimated Value
Purchase Details
Closed on
Apr 22, 1993
Sold by
Marangakis Evangelia
Bought by
Marangakis Anastasio
Purchase Details
Closed on
Jan 3, 1984
Sold by
Edge Joel I
Bought by
Marangakis Anastasio
Purchase Details
Closed on
Sep 8, 1978
Sold by
Mcclain Benny
Bought by
Edge Joel I
Purchase Details
Closed on
Mar 27, 1978
Sold by
Stephens Thomas H
Bought by
Mcclain Benny
Purchase Details
Closed on
Nov 30, 1973
Sold by
L & M Development Co
Bought by
Stephens Thomas H
Purchase Details
Closed on
Aug 20, 1973
Sold by
Bridges Donald B
Bought by
L & M Development Co
Purchase Details
Closed on
Nov 19, 1971
Sold by
Leithauser Don G
Bought by
Bridges Donald B
Purchase Details
Closed on
Aug 1, 1971
Bought by
Leithauser Don G
Create a Home Valuation Report for This Property
The Home Valuation Report is an in-depth analysis detailing your home's value as well as a comparison with similar homes in the area
Home Values in the Area
Average Home Value in this Area
Purchase History
| Date | Buyer | Sale Price | Title Company |
|---|---|---|---|
| Marangakis Evangelia | -- | -- | |
| Marangakis Anastasio | -- | -- | |
| Marangakis Anastasio | -- | -- | |
| Edge Joel I | -- | -- | |
| Mcclain Benny | -- | -- | |
| Stephens Thomas H | -- | -- | |
| L & M Development Co | -- | -- | |
| Bridges Donald B | -- | -- | |
| Leithauser Don G | -- | -- |
Source: Public Records
Tax History Compared to Growth
Tax History
| Year | Tax Paid | Tax Assessment Tax Assessment Total Assessment is a certain percentage of the fair market value that is determined by local assessors to be the total taxable value of land and additions on the property. | Land | Improvement |
|---|---|---|---|---|
| 2024 | $1,792 | $85,718 | $12,000 | $73,718 |
| 2023 | $1,324 | $55,798 | $8,000 | $47,798 |
| 2022 | $1,077 | $45,398 | $4,080 | $41,318 |
| 2021 | $1,091 | $45,398 | $4,080 | $41,318 |
| 2020 | $1,094 | $45,398 | $4,080 | $41,318 |
| 2019 | $1,004 | $37,379 | $4,000 | $33,379 |
| 2018 | $884 | $32,090 | $3,264 | $28,826 |
| 2017 | $873 | $32,090 | $3,264 | $28,826 |
| 2016 | $873 | $32,090 | $3,264 | $28,826 |
| 2015 | $865 | $31,680 | $3,264 | $28,416 |
| 2014 | $741 | $28,940 | $2,770 | $26,170 |
Source: Public Records
Map
Nearby Homes
- 10 Woodglen Dr
- 202 Ridgewood Rd
- 209 Ridgewood Rd
- 1101 East Ave
- 618 Valley Rd
- 645 Valley Rd
- 662 Hillside Dr
- 660 Valley Rd
- 109 Perry St
- 00 Juliette St
- 537 Fletcher St
- 77 Ben Dr W
- 427 Park St
- 0 Coaling Rd Unit 9221-D 10352096
- 0 Coaling Rd Unit 9221-C 10352086
- 0 Coaling Rd Unit 9221 10352063
- 0 Coaling Rd Unit 9221-B 10352079
- 254 E Girard Ave
- 12 Breckenridge Dr
- 292 Kimwood Dr
- 205 Greenview Ct
- 303 Greenview Ct
- 102 Ridgewood Rd
- 300 Greenview Ct
- 305 Greenview Ct
- 307 Greenview Ct
- 111 Rolling Hills Rd
- 201 Greenview Ct
- 104 Ridgewood Rd
- 304 Greenview Ct
- 603 Harris Cir
- 401 Greenview Ct
- 108 Ridgewood Rd
- 20 Woodglen Dr
- 107 Rolling Hills Rd
- 106 Rolling Hills Rd
- 100 Ridgewood Rd
- 113 Greenview Ct
- 0 Greenview Ct Unit 30 8121835
- 0 Greenview Ct