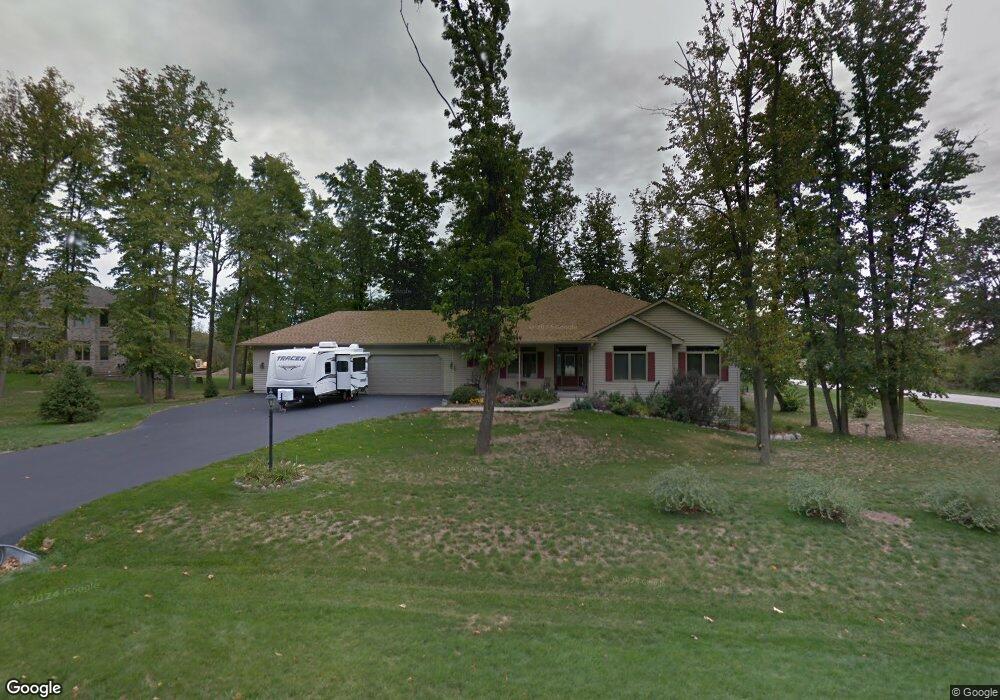
301 Hickory Ln Kirkland, IL 60146
Estimated Value: $360,676 - $481,000
3
Beds
2
Baths
2,134
Sq Ft
$195/Sq Ft
Est. Value
About This Home
This home is located at 301 Hickory Ln, Kirkland, IL 60146 and is currently estimated at $416,669, approximately $195 per square foot. 301 Hickory Ln is a home located in DeKalb County with nearby schools including Hiawatha Elementary School and Hiawatha Jr./Sr. High School.
Ownership History
Date
Name
Owned For
Owner Type
Purchase Details
Closed on
May 18, 2007
Sold by
Rood Robert D
Bought by
Upchurch Lisa L
Current Estimated Value
Home Financials for this Owner
Home Financials are based on the most recent Mortgage that was taken out on this home.
Original Mortgage
$307,814
Outstanding Balance
$187,642
Interest Rate
6.21%
Mortgage Type
New Conventional
Estimated Equity
$229,027
Purchase Details
Closed on
Jan 31, 2007
Sold by
National Bank & Trust Co Sycam
Bought by
Rood Robert D and Rood Ann M
Create a Home Valuation Report for This Property
The Home Valuation Report is an in-depth analysis detailing your home's value as well as a comparison with similar homes in the area
Home Values in the Area
Average Home Value in this Area
Purchase History
| Date | Buyer | Sale Price | Title Company |
|---|---|---|---|
| Upchurch Lisa L | $383,500 | -- | |
| Rood Robert D | -- | -- |
Source: Public Records
Mortgage History
| Date | Status | Borrower | Loan Amount |
|---|---|---|---|
| Open | Upchurch Lisa L | $307,814 |
Source: Public Records
Tax History Compared to Growth
Tax History
| Year | Tax Paid | Tax Assessment Tax Assessment Total Assessment is a certain percentage of the fair market value that is determined by local assessors to be the total taxable value of land and additions on the property. | Land | Improvement |
|---|---|---|---|---|
| 2024 | $9,030 | $106,783 | $36,880 | $69,903 |
| 2023 | $9,030 | $98,354 | $33,969 | $64,385 |
| 2022 | $8,833 | $95,777 | $33,079 | $62,698 |
| 2021 | $8,835 | $92,342 | $31,893 | $60,449 |
| 2020 | $8,881 | $91,026 | $33,641 | $57,385 |
| 2019 | $8,750 | $88,349 | $32,652 | $55,697 |
| 2018 | $8,898 | $89,295 | $31,723 | $57,572 |
| 2017 | $8,666 | $87,049 | $30,925 | $56,124 |
| 2016 | $8,608 | $85,092 | $30,230 | $54,862 |
| 2015 | -- | $79,861 | $28,372 | $51,489 |
| 2014 | -- | $73,849 | $26,236 | $47,613 |
| 2013 | -- | $76,000 | $27,000 | $49,000 |
Source: Public Records
Map
Nearby Homes
- 206 Kyle Ln
- 210 Hickory Ln
- 208 Hickory Ln
- TractA Route 72 Hwy
- 115 W South St
- 101 Forest Dr
- 111 Evergreen Dr
- 1607 Wheeler Rd
- 32300 White St
- 0 West St
- Lot 13 Route 72 Hwy
- Lot 5 Route 72 Hwy
- 0 Crill Rd
- 6610 Cherry Valley Rd
- 00 Wolf Rd
- 8770 Lettow Rd
- 30789 5 Points Rd
- 1406 Wheeler Rd
- 803 Linda Ln
- 5553 N Mulford Rd