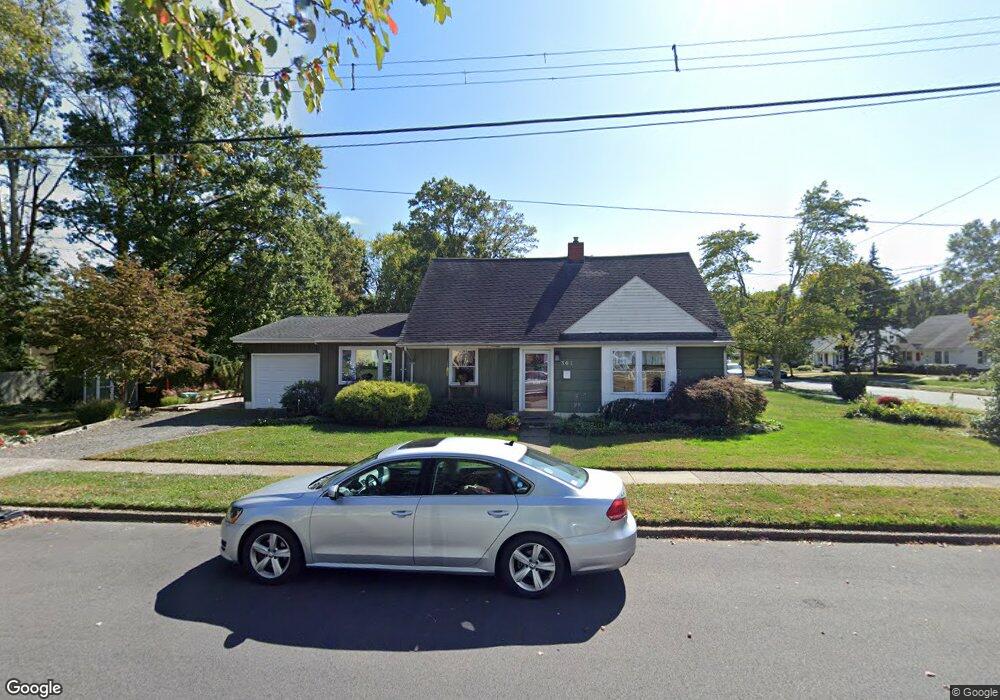
301 High St Moorestown, NJ 08057
Estimated Value: $554,115 - $646,000
Studio
--
Bath
2,085
Sq Ft
$292/Sq Ft
Est. Value
About This Home
This home is located at 301 High St, Moorestown, NJ 08057 and is currently estimated at $608,779, approximately $291 per square foot. 301 High St is a home located in Burlington County with nearby schools including Mary E. Roberts Elementary School, Moorestown Upper Elementary School, and William Allen Middle School.
Ownership History
Date
Name
Owned For
Owner Type
Purchase Details
Closed on
Jul 27, 2001
Sold by
Masucci Maurice R and Masucci Paula G
Bought by
Lanza Michele
Current Estimated Value
Home Financials for this Owner
Home Financials are based on the most recent Mortgage that was taken out on this home.
Original Mortgage
$100,000
Outstanding Balance
$38,980
Interest Rate
7.14%
Estimated Equity
$569,799
Purchase Details
Closed on
Aug 18, 1995
Sold by
Verderosa Mary Lou and Umberger Pauline A
Bought by
Masucci Maurice R and Masucci Paula G
Create a Home Valuation Report for This Property
The Home Valuation Report is an in-depth analysis detailing your home's value as well as a comparison with similar homes in the area
Home Values in the Area
Average Home Value in this Area
Purchase History
| Date | Buyer | Sale Price | Title Company |
|---|---|---|---|
| Lanza Michele | $175,000 | Infinity Title Agency Inc | |
| Masucci Maurice R | $101,000 | Infinity Title Agency Inc |
Source: Public Records
Mortgage History
| Date | Status | Borrower | Loan Amount |
|---|---|---|---|
| Open | Lanza Michele | $100,000 |
Source: Public Records
Tax History
| Year | Tax Paid | Tax Assessment Tax Assessment Total Assessment is a certain percentage of the fair market value that is determined by local assessors to be the total taxable value of land and additions on the property. | Land | Improvement |
|---|---|---|---|---|
| 2025 | $7,319 | $258,000 | $140,100 | $117,900 |
| 2024 | $7,098 | $258,000 | $140,100 | $117,900 |
| 2023 | $7,098 | $258,000 | $140,100 | $117,900 |
| 2022 | $7,025 | $258,000 | $140,100 | $117,900 |
| 2021 | $6,932 | $258,000 | $140,100 | $117,900 |
| 2020 | $6,889 | $258,000 | $140,100 | $117,900 |
| 2019 | $6,767 | $258,000 | $140,100 | $117,900 |
| 2018 | $6,584 | $258,000 | $140,100 | $117,900 |
| 2017 | $6,641 | $258,000 | $140,100 | $117,900 |
| 2016 | $5,784 | $258,000 | $140,100 | $117,900 |
| 2015 | $5,714 | $258,000 | $140,100 | $117,900 |
| 2014 | $5,426 | $258,000 | $140,100 | $117,900 |
Source: Public Records
Map
Nearby Homes
- 129 S Church St
- 8 S Close Unit 8
- 10 E Close Unit 10EAST
- 22 E Close Unit 22
- 15 W Close Unit 15
- 228 Mill St
- 66 E 3rd St
- 104 Mount Laurel Rd
- 80 E 3rd St
- 127 Schooley St
- 133 Plum St Unit 6
- 111 Fellowship Rd
- 217 Hooton Rd
- 308 Elm St
- 444 Shady Ln
- 205 E Central Ave
- 307 Fairview Ave
- 401 W 3rd St
- 325 E 2nd St
- 337 E 2nd St
Your Personal Tour Guide
Ask me questions while you tour the home.