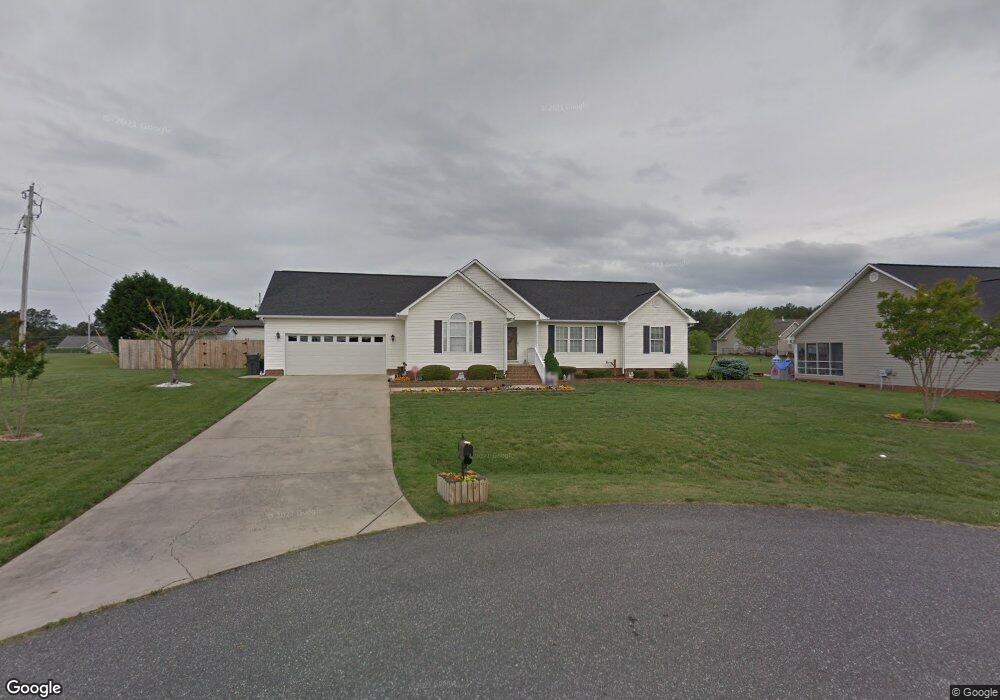
301 Holstein Dr Dallas, NC 28034
Estimated Value: $336,922 - $354,000
3
Beds
2
Baths
1,459
Sq Ft
$239/Sq Ft
Est. Value
About This Home
This home is located at 301 Holstein Dr, Dallas, NC 28034 and is currently estimated at $348,231, approximately $238 per square foot. 301 Holstein Dr is a home located in Gaston County with nearby schools including Costner Elementary School, W.C. Friday Middle School, and North Gaston High School.
Ownership History
Date
Name
Owned For
Owner Type
Purchase Details
Closed on
Jun 22, 2015
Sold by
Wilson Elizabeth S and Barker Elizabeth S
Bought by
Voiles Edith Myrlee
Current Estimated Value
Purchase Details
Closed on
Aug 14, 2006
Sold by
Nixon Michael Alex and Nixon Lisa Trantham
Bought by
Voiles Johnny F and Voiles Edith M
Home Financials for this Owner
Home Financials are based on the most recent Mortgage that was taken out on this home.
Original Mortgage
$116,000
Outstanding Balance
$69,569
Interest Rate
6.74%
Mortgage Type
Credit Line Revolving
Estimated Equity
$278,662
Purchase Details
Closed on
Jul 28, 2000
Sold by
Castlegate Construction Co Inc
Bought by
Nixon Michael Alex and Nixon Lisa Trantham
Home Financials for this Owner
Home Financials are based on the most recent Mortgage that was taken out on this home.
Original Mortgage
$113,753
Interest Rate
8.23%
Mortgage Type
FHA
Create a Home Valuation Report for This Property
The Home Valuation Report is an in-depth analysis detailing your home's value as well as a comparison with similar homes in the area
Home Values in the Area
Average Home Value in this Area
Purchase History
| Date | Buyer | Sale Price | Title Company |
|---|---|---|---|
| Voiles Edith Myrlee | -- | Attorney | |
| Voiles Johnny F | $139,000 | Chicago Title Insurance Co | |
| Nixon Michael Alex | $124,000 | -- |
Source: Public Records
Mortgage History
| Date | Status | Borrower | Loan Amount |
|---|---|---|---|
| Open | Voiles Johnny F | $116,000 | |
| Previous Owner | Nixon Michael Alex | $113,753 |
Source: Public Records
Tax History Compared to Growth
Tax History
| Year | Tax Paid | Tax Assessment Tax Assessment Total Assessment is a certain percentage of the fair market value that is determined by local assessors to be the total taxable value of land and additions on the property. | Land | Improvement |
|---|---|---|---|---|
| 2025 | $1,632 | $314,060 | $26,500 | $287,560 |
| 2024 | $1,300 | $314,060 | $26,500 | $287,560 |
| 2023 | $917 | $314,060 | $26,500 | $287,560 |
| 2022 | $746 | $170,070 | $22,500 | $147,570 |
| 2021 | $113 | $170,070 | $22,500 | $147,570 |
| 2019 | $1,054 | $170,070 | $22,500 | $147,570 |
| 2018 | $833 | $139,768 | $22,400 | $117,368 |
| 2017 | $833 | $139,768 | $22,400 | $117,368 |
| 2016 | $835 | $139,768 | $0 | $0 |
Source: Public Records
Map
Nearby Homes
- 111 Summey Barker Dr
- 00 Summey Farm Dr
- 600 Summey Farm Dr
- 2017 Longhorn Dr
- 4040 Hereford Ln
- 912 Carole Summey Dr
- 4016 Hereford Ln
- 322 Pinkney Rd
- 3259 Winesap Dr
- 3173 Green Apple Dr
- 1001 College Blvd
- 109 Churchill Rd
- 3120 Green Apple Dr
- 2612 Mcintosh St
- 5606 Katherine Ct
- 2504 Mcintosh St
- 3032 Green Apple Dr
- 6103 Dane Dr
- 5117 Park Place Dr
- 0 Dallas High Shoals Hwy
- 305 Holstein Dr
- 122 Summey Barker Dr
- 300 Holstein Dr
- 126 Summey Barker Dr
- 309 Holstein Dr
- 302 Holstein Dr
- 306 Holstein Dr
- 130 Summey Barker Dr
- 313 Holstein Dr
- 310 Holstein Dr
- 310 Holstein Dr Unit 19
- 134 Summey Barker Dr
- 1710 Dallas Cherryville Hwy
- 317 Holstein Dr
- 1700 Dallas Cherryville Hwy
- 1704 Dallas Cherryville Hwy
- 314 Holstein Dr
- 125 Summey Barker Dr
- 119 Summey Barker Dr
- 138 Summey Barker Dr