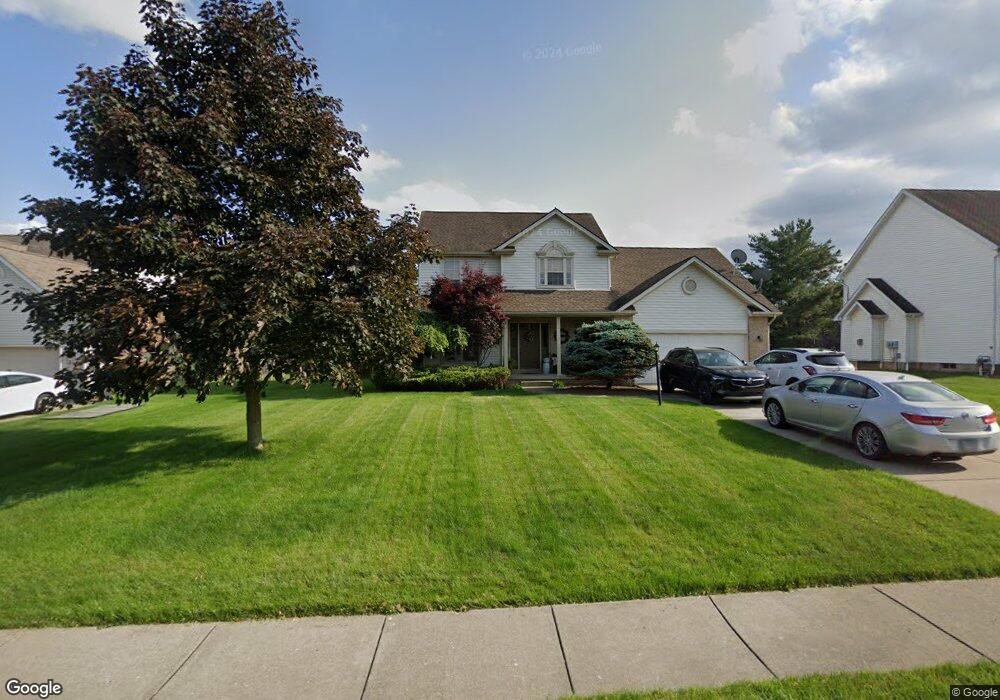
301 Lake Pointe Cir Unit 301 Canfield, OH 44406
Estimated Value: $284,526 - $305,000
2
Beds
2
Baths
1,392
Sq Ft
$213/Sq Ft
Est. Value
About This Home
This home is located at 301 Lake Pointe Cir Unit 301, Canfield, OH 44406 and is currently estimated at $296,882, approximately $213 per square foot. 301 Lake Pointe Cir Unit 301 is a home located in Mahoning County with nearby schools including Canfield Village Middle School and Canfield High School.
Ownership History
Date
Name
Owned For
Owner Type
Purchase Details
Closed on
May 17, 2023
Bought by
Joy Frank J
Current Estimated Value
Purchase Details
Closed on
Apr 18, 2023
Sold by
Joy Frank J and Joy Mary Lou
Bought by
Humphries Christina M and Veneroso Mary Ann
Purchase Details
Closed on
Mar 3, 2011
Bought by
Frank J Joy and Lou Mary
Purchase Details
Closed on
Nov 29, 2000
Sold by
Mill Creek Enterprises Inc and Salata Richard A
Bought by
Joy Frank J and Joy Mary Lou
Home Financials for this Owner
Home Financials are based on the most recent Mortgage that was taken out on this home.
Original Mortgage
$103,000
Interest Rate
7.58%
Create a Home Valuation Report for This Property
The Home Valuation Report is an in-depth analysis detailing your home's value as well as a comparison with similar homes in the area
Home Values in the Area
Average Home Value in this Area
Purchase History
| Date | Buyer | Sale Price | Title Company |
|---|---|---|---|
| Joy Frank J | -- | -- | |
| Humphries Christina M | -- | -- | |
| Frank J Joy | -- | -- | |
| Joy Frank J | $182,900 | -- |
Source: Public Records
Mortgage History
| Date | Status | Borrower | Loan Amount |
|---|---|---|---|
| Previous Owner | Joy Frank J | $103,000 |
Source: Public Records
Tax History Compared to Growth
Tax History
| Year | Tax Paid | Tax Assessment Tax Assessment Total Assessment is a certain percentage of the fair market value that is determined by local assessors to be the total taxable value of land and additions on the property. | Land | Improvement |
|---|---|---|---|---|
| 2024 | $3,599 | $93,290 | $8,750 | $84,540 |
| 2023 | $3,568 | $93,290 | $8,750 | $84,540 |
| 2022 | $2,510 | $55,810 | $7,560 | $48,250 |
| 2021 | $2,436 | $55,810 | $7,560 | $48,250 |
| 2020 | $2,446 | $55,810 | $7,560 | $48,250 |
| 2019 | $2,459 | $51,680 | $7,000 | $44,680 |
| 2018 | $2,429 | $51,680 | $7,000 | $44,680 |
| 2017 | $2,426 | $51,680 | $7,000 | $44,680 |
| 2016 | $2,079 | $46,230 | $7,000 | $39,230 |
| 2015 | $2,034 | $46,230 | $7,000 | $39,230 |
| 2014 | $2,042 | $46,230 | $7,000 | $39,230 |
| 2013 | $1,968 | $46,230 | $7,000 | $39,230 |
Source: Public Records
Map
Nearby Homes
- 291 Lake Pointe Cir Unit 291
- 7040 (LOT #28) S Palmyra Rd
- 7060 (LOT #29) S Palmyra Rd
- 6120 Century Blvd
- 7120 (LOT #32) S Palmyra Rd
- 6090 Century Blvd
- 6080 (LOT 44) Century Blvd
- 6025 (LOT #54) Century Blvd
- 6135 (LOT #65) Century Blvd
- 6020 (LOT #39) Century Blvd
- 18 Hunters Woods Blvd Unit C
- 435 Bradford Dr
- 6740 Pheasant Run Dr
- 331 Verdant Ln
- 365 Sleepy Hollow Dr
- 264 W Main St
- 675 Blueberry Hill Dr
- 755 Blueberry Hill Dr
- 218 Moreland Dr
- 124 Wadsworth St
- 41 Lake Pointe Cir
- 281 Lake Pointe Cir Unit 281
- 41 Preserve Blvd
- 61 Lake Pointe Cir
- 51 Preserve Blvd
- 31 Preserve Blvd
- 251 Lake Pointe Cir Unit 251
- 30 Lake Pointe Cir Unit 30
- 71 Lake Pointe Cir
- 20 Lake Pointe Cir
- 61 Preserve Blvd
- 40 Lake Pointe Cir
- 241 Lake Pointe Cir Unit 241
- 10 Lake Pointe Cir
- 50 Lake Pointe Cir Unit 50
- 221 Lake Pointe Cir
- 270 Lake Pointe Cir Unit 270
- 81 Lake Pointe Cir Unit 81
- 60 Lake Pointe Cir
- 32 Preserve Blvd