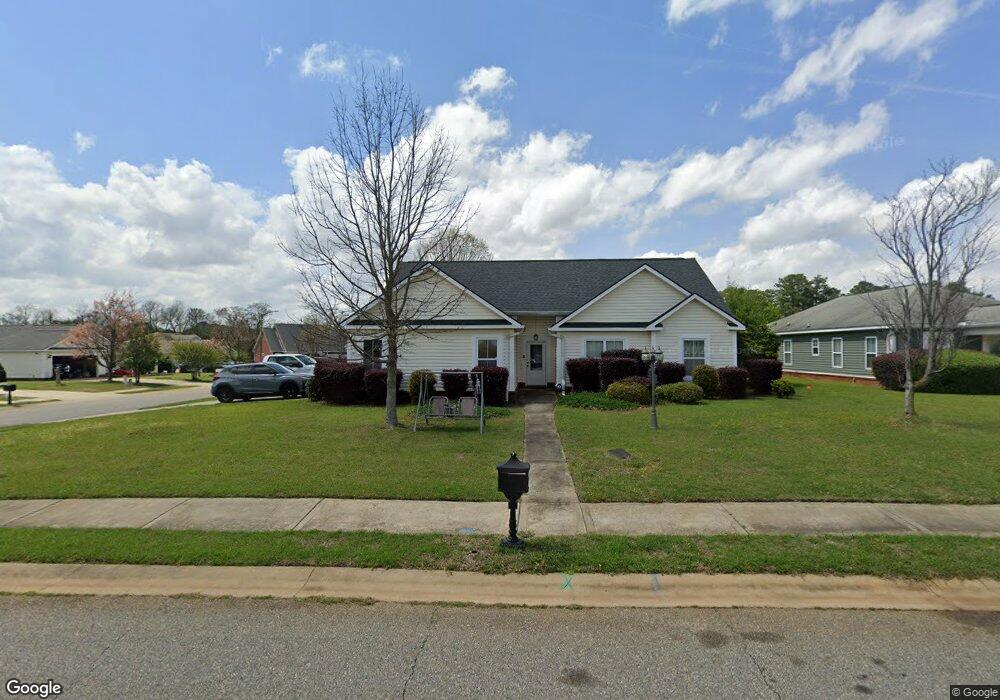
301 Latham Dr Warner Robins, GA 31088
Estimated Value: $215,000 - $264,000
Studio
--
Bath
1,466
Sq Ft
$165/Sq Ft
Est. Value
About This Home
This home is located at 301 Latham Dr, Warner Robins, GA 31088 and is currently estimated at $242,467, approximately $165 per square foot. 301 Latham Dr is a home located in Houston County with nearby schools including David A. Perdue Primary School, David A. Perdue Elementary School, and Feagin Mill Middle School.
Ownership History
Date
Name
Owned For
Owner Type
Purchase Details
Closed on
Aug 4, 2025
Sold by
Melendez Rafael
Bought by
Casillas George and Casillas Alysia
Current Estimated Value
Home Financials for this Owner
Home Financials are based on the most recent Mortgage that was taken out on this home.
Original Mortgage
$200,000
Outstanding Balance
$199,828
Interest Rate
6.77%
Mortgage Type
VA
Estimated Equity
$42,639
Purchase Details
Closed on
Jan 12, 2007
Sold by
C W Williams Homes Inc
Bought by
C W Williams Homes & Neighborhoods Inc
Home Financials for this Owner
Home Financials are based on the most recent Mortgage that was taken out on this home.
Original Mortgage
$116,000
Interest Rate
6.05%
Mortgage Type
Purchase Money Mortgage
Purchase Details
Closed on
Sep 7, 2006
Sold by
Leclay Inc
Bought by
C W Williams Homes Inc
Purchase Details
Closed on
Apr 27, 2004
Sold by
C W Williams Homes & Neighborhoods Inc
Bought by
Melendez Rafael
Home Financials for this Owner
Home Financials are based on the most recent Mortgage that was taken out on this home.
Original Mortgage
$142,907
Interest Rate
6.1%
Mortgage Type
VA
Create a Home Valuation Report for This Property
The Home Valuation Report is an in-depth analysis detailing your home's value as well as a comparison with similar homes in the area
Home Values in the Area
Average Home Value in this Area
Purchase History
| Date | Buyer | Sale Price | Title Company |
|---|---|---|---|
| Casillas George | $200,000 | None Listed On Document | |
| Casillas George | $200,000 | None Listed On Document | |
| C W Williams Homes & Neighborhoods Inc | $27,600 | None Available | |
| C W Williams Homes Inc | $25,000 | -- | |
| Melendez Rafael | $139,900 | None Available |
Source: Public Records
Mortgage History
| Date | Status | Borrower | Loan Amount |
|---|---|---|---|
| Open | Casillas George | $200,000 | |
| Closed | Casillas George | $200,000 | |
| Previous Owner | C W Williams Homes & Neighborhoods Inc | $116,000 | |
| Previous Owner | Melendez Rafael | $142,907 |
Source: Public Records
Tax History
| Year | Tax Paid | Tax Assessment Tax Assessment Total Assessment is a certain percentage of the fair market value that is determined by local assessors to be the total taxable value of land and additions on the property. | Land | Improvement |
|---|---|---|---|---|
| 2025 | -- | $90,600 | $10,000 | $80,600 |
| 2024 | -- | $83,560 | $10,000 | $73,560 |
| 2023 | $0 | $70,960 | $10,000 | $60,960 |
| 2022 | $2,042 | $61,920 | $9,200 | $52,720 |
| 2021 | $1,749 | $52,560 | $9,200 | $43,360 |
| 2020 | $1,580 | $47,480 | $9,200 | $38,280 |
| 2019 | $1,580 | $47,480 | $9,200 | $38,280 |
| 2018 | $0 | $47,480 | $9,200 | $38,280 |
| 2017 | $1,104 | $47,480 | $9,200 | $38,280 |
| 2016 | $1,178 | $50,600 | $9,200 | $41,400 |
| 2015 | -- | $52,720 | $9,200 | $43,520 |
| 2014 | $527 | $53,120 | $9,200 | $43,920 |
| 2013 | $527 | $52,720 | $9,200 | $43,520 |
Source: Public Records
Map
Nearby Homes
- 301 Meyers Lake Dr
- 404 Minter Dr
- 213 Air Park Dr
- 305 Carver Ct
- 108 Holbeck Ct
- 307 Carver Ct
- 401 Bella Notte Cir Unit 5D
- 401 Bella Notte Cir
- 414 Bella Notte Cir
- 414 Bella Notte Cir Unit 23A
- 409 Bella Notte Cir Unit 1D
- 409 Bella Notte Cir
- 504 Haverhill Cir
- 500 Bella Notte Cir Unit 16A
- 500 Bella Notte Cir
- 502 Bella Notte Cir
- 502 Bella Notte Cir Unit 15A
- 112 Ballyhara
- 316 Haverhill Cir
- 208 Twelve Oaks Dr
- 303 Latham Dr
- 300 Latham Dr
- 210 Courthouse Ln
- 101 Mount Pilot Ct
- 208 Courthouse Ln
- 305 Latham Dr
- 200 Courthouse Ln
- 229 Courthouse Ln
- 227 Courthouse Ln
- 206 Courthouse Ln
- 200 Latham Dr
- 103 Mount Pilot Ct
- 401 Latham Dr
- 225 Courthouse Ln
- 100 Mount Pilot Ct
- 204 Courthouse Ln
- 107 Mount Pilot Ct
- 105 Mount Pilot Ct
- 102 Mount Pilot Ct
- 219 Courthouse Ln
Your Personal Tour Guide
Ask me questions while you tour the home.