Estimated Value: $348,000 - $366,000
2
Beds
1
Bath
900
Sq Ft
$394/Sq Ft
Est. Value
About This Home
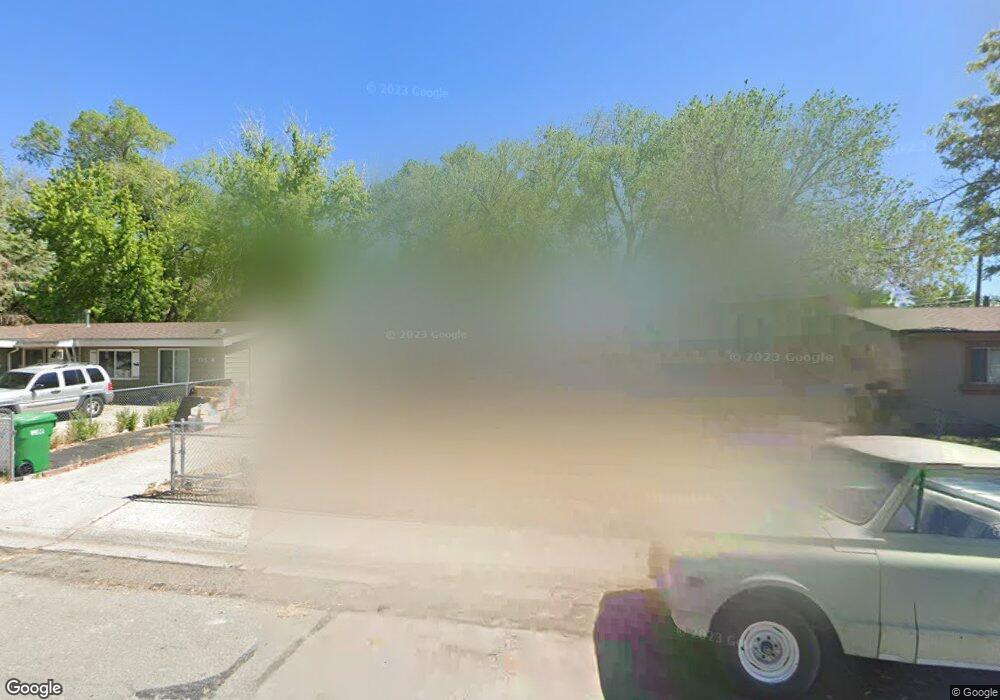
This home is located at 301 M St, Sparks, NV 89431 and is currently estimated at $354,844, approximately $394 per square foot. 301 M St is a home located in Washoe County with nearby schools including Greenbrae Elementary School, George L Dilworth Middle School, and Sparks High School.
Ownership History
Date
Name
Owned For
Owner Type
Purchase Details
Closed on
Mar 19, 2010
Sold by
Fredrickson Joel T and Fredrickson Judy R
Bought by
Sisco Shannon L
Current Estimated Value
Home Financials for this Owner
Home Financials are based on the most recent Mortgage that was taken out on this home.
Original Mortgage
$88,369
Outstanding Balance
$58,435
Interest Rate
5.25%
Mortgage Type
FHA
Estimated Equity
$296,409
Purchase Details
Closed on
Apr 23, 2001
Sold by
Peterson Carl R and Peterson Shirley Pat
Bought by
Peterson Carl R and Peterson Shirley Pat
Create a Home Valuation Report for This Property
The Home Valuation Report is an in-depth analysis detailing your home's value as well as a comparison with similar homes in the area
Home Values in the Area
Average Home Value in this Area
Purchase History
| Date | Buyer | Sale Price | Title Company |
|---|---|---|---|
| Sisco Shannon L | $90,000 | First American Title Reno | |
| Peterson Carl R | $300,000 | -- |
Source: Public Records
Mortgage History
| Date | Status | Borrower | Loan Amount |
|---|---|---|---|
| Open | Sisco Shannon L | $88,369 |
Source: Public Records
Tax History
| Year | Tax Paid | Tax Assessment Tax Assessment Total Assessment is a certain percentage of the fair market value that is determined by local assessors to be the total taxable value of land and additions on the property. | Land | Improvement |
|---|---|---|---|---|
| 2026 | $426 | $46,802 | $34,090 | $12,712 |
| 2024 | $556 | $42,280 | $30,065 | $12,215 |
| 2023 | $541 | $42,574 | $31,325 | $11,249 |
| 2022 | $525 | $35,366 | $26,180 | $9,186 |
| 2021 | $510 | $26,873 | $17,955 | $8,918 |
| 2020 | $494 | $25,708 | $16,940 | $8,768 |
| 2019 | $480 | $24,198 | $15,890 | $8,308 |
| 2018 | $466 | $19,678 | $11,725 | $7,953 |
| 2017 | $453 | $18,216 | $10,395 | $7,821 |
| 2016 | $441 | $17,152 | $9,345 | $7,807 |
| 2015 | $441 | $15,434 | $7,700 | $7,734 |
| 2014 | $428 | $13,718 | $6,440 | $7,278 |
| 2013 | -- | $11,377 | $4,270 | $7,107 |
Source: Public Records
Map
Nearby Homes
Your Personal Tour Guide
Ask me questions while you tour the home.