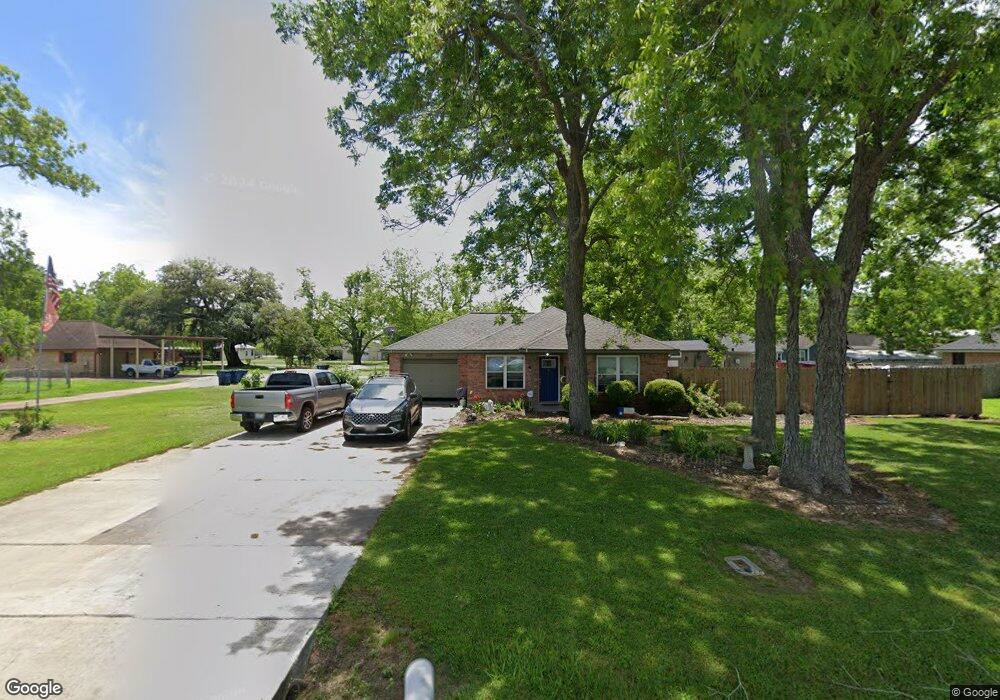
301 Marion St Brazoria, TX 77422
Estimated Value: $151,339 - $185,000
2
Beds
1
Bath
868
Sq Ft
$189/Sq Ft
Est. Value
About This Home
This home is located at 301 Marion St, Brazoria, TX 77422 and is currently estimated at $163,835, approximately $188 per square foot. 301 Marion St is a home located in Brazoria County.
Ownership History
Date
Name
Owned For
Owner Type
Purchase Details
Closed on
Mar 25, 2025
Sold by
Cribbs Samuel Dennis
Bought by
Cribbs Stephanie Marie
Current Estimated Value
Purchase Details
Closed on
Mar 2, 2005
Sold by
George Lynda and Jeffers Lynda
Bought by
Cribbs Samuel D and Brast Stephanie M
Home Financials for this Owner
Home Financials are based on the most recent Mortgage that was taken out on this home.
Original Mortgage
$69,351
Interest Rate
5.71%
Mortgage Type
FHA
Create a Home Valuation Report for This Property
The Home Valuation Report is an in-depth analysis detailing your home's value as well as a comparison with similar homes in the area
Home Values in the Area
Average Home Value in this Area
Purchase History
| Date | Buyer | Sale Price | Title Company |
|---|---|---|---|
| Cribbs Stephanie Marie | -- | None Listed On Document | |
| Cribbs Samuel D | -- | Alamo Title Company |
Source: Public Records
Mortgage History
| Date | Status | Borrower | Loan Amount |
|---|---|---|---|
| Previous Owner | Cribbs Samuel D | $69,351 |
Source: Public Records
Tax History Compared to Growth
Tax History
| Year | Tax Paid | Tax Assessment Tax Assessment Total Assessment is a certain percentage of the fair market value that is determined by local assessors to be the total taxable value of land and additions on the property. | Land | Improvement |
|---|---|---|---|---|
| 2025 | $876 | $157,200 | $25,900 | $131,300 |
| 2023 | $876 | $144,377 | $27,730 | $131,340 |
| 2022 | $2,072 | $131,252 | $24,470 | $113,180 |
| 2021 | $2,000 | $119,320 | $21,210 | $98,110 |
| 2020 | $2,032 | $115,080 | $19,570 | $95,510 |
| 2019 | $1,886 | $103,000 | $10,480 | $92,520 |
| 2018 | $1,846 | $100,050 | $8,630 | $91,420 |
| 2017 | $1,865 | $100,050 | $8,630 | $91,420 |
| 2016 | $1,729 | $93,440 | $8,630 | $84,810 |
| 2014 | $1,227 | $85,040 | $8,630 | $76,410 |
Source: Public Records
Map
Nearby Homes