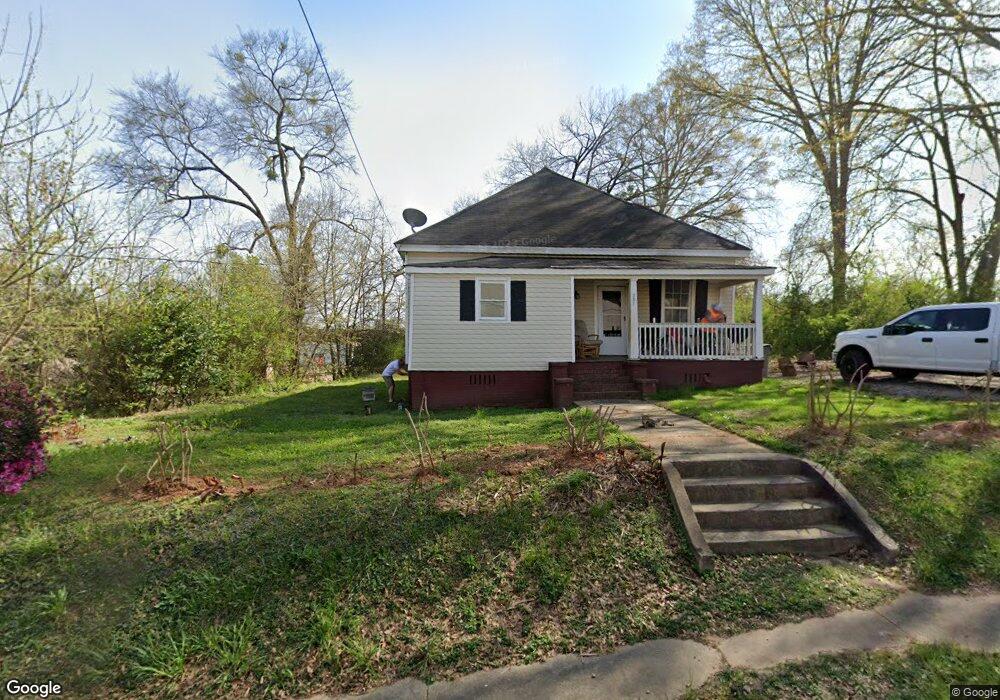
301 Miller St Lagrange, GA 30240
Estimated Value: $155,000 - $421,777
3
Beds
1
Bath
1,199
Sq Ft
$254/Sq Ft
Est. Value
About This Home
This home is located at 301 Miller St, Lagrange, GA 30240 and is currently estimated at $304,444, approximately $253 per square foot. 301 Miller St is a home located in Troup County with nearby schools including Ethel W. Kight Elementary School, Hollis Hand Elementary School, and Franklin Forest Elementary School.
Ownership History
Date
Name
Owned For
Owner Type
Purchase Details
Closed on
Mar 24, 2023
Sold by
Dobbs Ellen W
Bought by
Swansonegger Investments Llc
Current Estimated Value
Purchase Details
Closed on
Nov 1, 1988
Sold by
Dobbs Mike and Dobbs Ellen
Bought by
Dobbs Ellen Ann Wood
Purchase Details
Closed on
Aug 13, 1985
Sold by
John C Turner
Bought by
Dobbs Mike and Dobbs Ellen
Purchase Details
Closed on
Aug 12, 1985
Sold by
Ralph Matthews J
Bought by
John C Turner
Purchase Details
Closed on
Oct 26, 1984
Sold by
Mullennix Annie
Bought by
Ralph Matthews J
Purchase Details
Closed on
Oct 4, 1984
Sold by
Knott Ruby G and Mullennix Annie
Bought by
Mullennix Annie
Purchase Details
Closed on
Sep 14, 1978
Sold by
Estes Ruben C Etal
Bought by
Knott Ruby G and Mullennix Annie
Purchase Details
Closed on
Jun 24, 1978
Sold by
Estes Mattie B
Bought by
Estes Ruben C Etal
Purchase Details
Closed on
Aug 1, 1952
Sold by
Callaway Community Fdn
Bought by
Estes Mattie B
Create a Home Valuation Report for This Property
The Home Valuation Report is an in-depth analysis detailing your home's value as well as a comparison with similar homes in the area
Home Values in the Area
Average Home Value in this Area
Purchase History
| Date | Buyer | Sale Price | Title Company |
|---|---|---|---|
| Swansonegger Investments Llc | $350,000 | -- | |
| Dobbs Ellen Ann Wood | -- | -- | |
| Dobbs Mike | $10,600 | -- | |
| John C Turner | -- | -- | |
| Ralph Matthews J | $9,000 | -- | |
| Mullennix Annie | -- | -- | |
| Knott Ruby G | -- | -- | |
| Estes Ruben C Etal | -- | -- | |
| Estes Mattie B | -- | -- |
Source: Public Records
Tax History Compared to Growth
Tax History
| Year | Tax Paid | Tax Assessment Tax Assessment Total Assessment is a certain percentage of the fair market value that is determined by local assessors to be the total taxable value of land and additions on the property. | Land | Improvement |
|---|---|---|---|---|
| 2024 | $535 | $20,984 | $3,560 | $17,424 |
| 2023 | $608 | $22,304 | $3,560 | $18,744 |
| 2022 | $586 | $20,984 | $3,560 | $17,424 |
| 2021 | $419 | $13,904 | $3,560 | $10,344 |
| 2020 | $419 | $13,904 | $3,560 | $10,344 |
| 2019 | $407 | $13,488 | $3,744 | $9,744 |
| 2018 | $356 | $11,808 | $3,744 | $8,064 |
| 2017 | $356 | $11,808 | $3,744 | $8,064 |
| 2016 | $356 | $11,806 | $3,744 | $8,062 |
| 2015 | $352 | $11,656 | $3,594 | $8,062 |
| 2014 | $340 | $11,232 | $3,594 | $7,638 |
| 2013 | -- | $11,656 | $3,594 | $8,062 |
Source: Public Records
Map
Nearby Homes
- 804 Leeman St
- 801 Truitt Ave
- 208 Miller St
- 803 Truitt Ave
- 806 Leeman St
- 0 Miller St Unit 8296209
- 0 Miller St
- 809 Truitt Ave
- 808 Leeman St
- 811 Truitt Ave
- 808 Truitt Ave
- 813 Truitt Ave
- 712 S Greenwood St
- 0 Leeman St
- 710 S Greenwood St
- 411 Miller St
- 703 S Greenwood St
- 410 Miller St
- 221 Peachtree St
- 219 Peachtree St