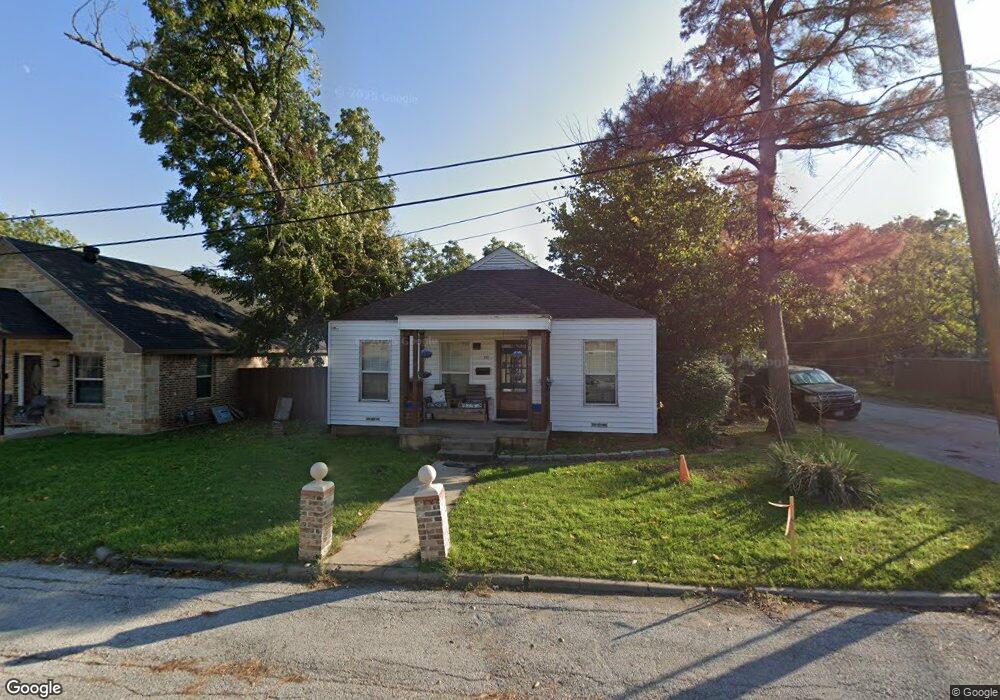
301 Moore St Grand Prairie, TX 75050
Estimated Value: $202,012 - $254,000
3
Beds
2
Baths
1,120
Sq Ft
$203/Sq Ft
Est. Value
About This Home
This home is located at 301 Moore St, Grand Prairie, TX 75050 and is currently estimated at $227,753, approximately $203 per square foot. 301 Moore St is a home located in Dallas County with nearby schools including Crosswinds High School, Delmas Morton Elementary School, and Digital Arts & Technology Academy at Adams Middle.
Ownership History
Date
Name
Owned For
Owner Type
Purchase Details
Closed on
Oct 28, 2010
Sold by
Fannie Mae
Bought by
Ambriz Ruben J
Current Estimated Value
Purchase Details
Closed on
Oct 8, 2010
Sold by
Financial Freedom Acquisition Llc
Bought by
Federal National Mortgage Association
Purchase Details
Closed on
Sep 7, 2010
Sold by
Aduddell Mary E and Aduddell Edwin L
Bought by
Financial Freedom Acquisition Llc
Create a Home Valuation Report for This Property
The Home Valuation Report is an in-depth analysis detailing your home's value as well as a comparison with similar homes in the area
Home Values in the Area
Average Home Value in this Area
Purchase History
| Date | Buyer | Sale Price | Title Company |
|---|---|---|---|
| Ambriz Ruben J | -- | Stnt | |
| Federal National Mortgage Association | -- | Stnt | |
| Financial Freedom Acquisition Llc | $68,941 | None Available |
Source: Public Records
Tax History Compared to Growth
Tax History
| Year | Tax Paid | Tax Assessment Tax Assessment Total Assessment is a certain percentage of the fair market value that is determined by local assessors to be the total taxable value of land and additions on the property. | Land | Improvement |
|---|---|---|---|---|
| 2025 | $826 | $169,820 | $22,800 | $147,020 |
| 2024 | $826 | $169,820 | $22,800 | $147,020 |
| 2023 | $826 | $125,210 | $15,200 | $110,010 |
| 2022 | $2,896 | $114,170 | $35,000 | $79,170 |
| 2021 | $1,869 | $70,340 | $28,000 | $42,340 |
| 2020 | $1,983 | $70,340 | $28,000 | $42,340 |
| 2019 | $1,611 | $55,150 | $15,000 | $40,150 |
| 2018 | $1,611 | $55,150 | $15,000 | $40,150 |
| 2017 | $1,275 | $43,670 | $15,000 | $28,670 |
| 2016 | $1,275 | $43,670 | $15,000 | $28,670 |
| 2015 | $1,222 | $43,670 | $15,000 | $28,670 |
| 2014 | $1,222 | $43,670 | $15,000 | $28,670 |
Source: Public Records
Map
Nearby Homes