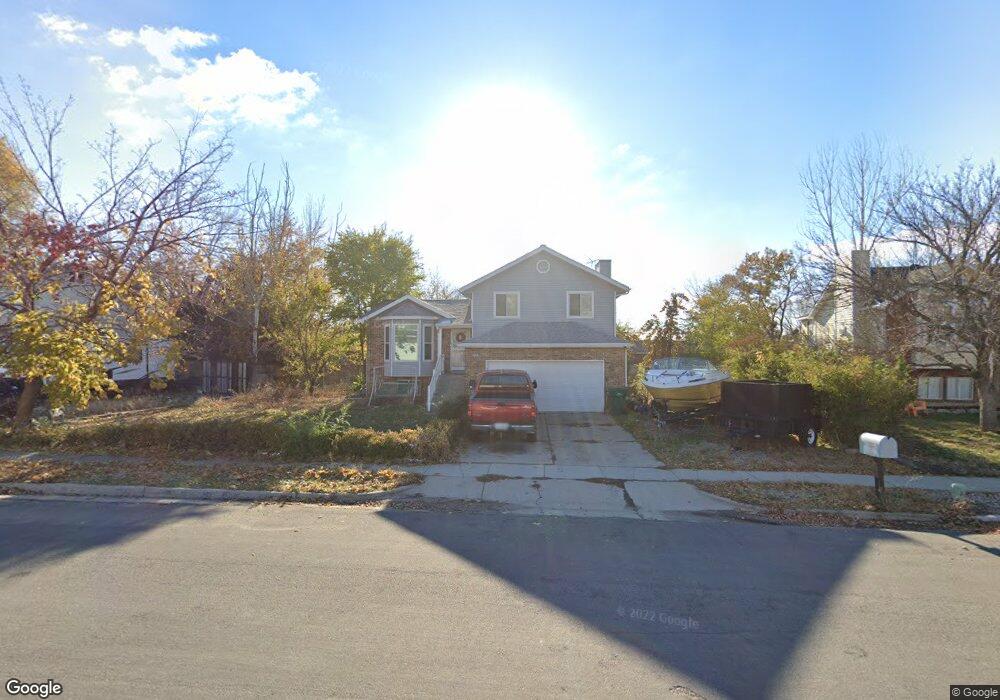
301 N 1500 E Layton, UT 84040
Estimated Value: $488,223 - $539,000
4
Beds
2
Baths
1,862
Sq Ft
$280/Sq Ft
Est. Value
About This Home
This home is located at 301 N 1500 E, Layton, UT 84040 and is currently estimated at $521,056, approximately $279 per square foot. 301 N 1500 E is a home located in Davis County with nearby schools including Whitesides Elementary School, Central Davis Junior High School, and Layton High School.
Ownership History
Date
Name
Owned For
Owner Type
Purchase Details
Closed on
Aug 4, 2017
Sold by
Wilson Gary and Wilson Suzette
Bought by
Butler Terrell and Butler Mariah
Current Estimated Value
Home Financials for this Owner
Home Financials are based on the most recent Mortgage that was taken out on this home.
Original Mortgage
$230,769
Outstanding Balance
$193,598
Interest Rate
4.25%
Mortgage Type
FHA
Estimated Equity
$327,458
Purchase Details
Closed on
Nov 4, 2009
Sold by
Cochell Monty J and Cochell Jana W
Bought by
Wilson Gary and Wilson Suzette
Home Financials for this Owner
Home Financials are based on the most recent Mortgage that was taken out on this home.
Original Mortgage
$196,270
Interest Rate
5.02%
Mortgage Type
VA
Create a Home Valuation Report for This Property
The Home Valuation Report is an in-depth analysis detailing your home's value as well as a comparison with similar homes in the area
Home Values in the Area
Average Home Value in this Area
Purchase History
| Date | Buyer | Sale Price | Title Company |
|---|---|---|---|
| Butler Terrell | -- | First American Title | |
| Wilson Gary | -- | Mountain View Title |
Source: Public Records
Mortgage History
| Date | Status | Borrower | Loan Amount |
|---|---|---|---|
| Open | Butler Terrell | $230,769 | |
| Previous Owner | Wilson Gary | $196,270 |
Source: Public Records
Tax History
| Year | Tax Paid | Tax Assessment Tax Assessment Total Assessment is a certain percentage of the fair market value that is determined by local assessors to be the total taxable value of land and additions on the property. | Land | Improvement |
|---|---|---|---|---|
| 2025 | $2,326 | $244,200 | $123,792 | $120,408 |
| 2024 | $2,231 | $235,950 | $147,746 | $88,204 |
| 2023 | $2,194 | $409,000 | $199,490 | $209,510 |
| 2022 | $2,331 | $235,950 | $106,981 | $128,969 |
| 2021 | $2,060 | $311,000 | $162,775 | $148,225 |
| 2020 | $1,816 | $263,000 | $131,643 | $131,357 |
| 2019 | $1,791 | $254,000 | $117,631 | $136,369 |
| 2018 | $1,622 | $231,000 | $91,447 | $139,553 |
| 2016 | $1,430 | $105,050 | $48,158 | $56,892 |
| 2015 | $1,385 | $96,580 | $48,158 | $48,422 |
| 2014 | $1,298 | $92,533 | $48,158 | $44,375 |
| 2013 | -- | $100,540 | $22,748 | $77,792 |
Source: Public Records
Map
Nearby Homes
- 1515 E Gentile St
- 1503 E 530 N
- 479 N 1375 E
- 1690 E Gentile St
- 508 N Adamswood Rd
- 1545 E 975 N
- 1033 E 825 N
- 187 N Talbot Dr
- 556 N Fairfield Rd Unit A2
- 556 N Fairfield Rd Unit D1
- 556 N Fairfield Rd Unit D2
- 556 N Fairfield Rd Unit A3
- 556 N Fairfield Rd Unit D3
- 556 N Fairfield Rd Unit D4
- 556 N Fairfield Rd Unit A1
- 556 N Fairfield Rd Unit A4
- 997 E 825 N
- 861 E 575 N
- 2877 E Gentile St Unit 2
- 1137 Holmes Creek Ln
- 313 N 1500 E
- 293 N 1500 E
- 300 Betty Lynn St
- 292 Betty Lynn St
- 284 Betty Lynn St
- 329 N 1500 E
- 285 N 1500 E
- 294 N 1500 E
- 306 N 1500 E
- 310 Betty Lynn St
- 286 N 1500 E
- 1742 E 300 N Unit 20
- 1435 E 275 N
- 1533 E 275 N
- 389 N 1500 E Unit 16
- 297 Betty Lynn St
- 392 N 1500 E Unit 15
- 285 N 1425 E
- 380 N Isabella Dr
- 277 N 1425 E
Your Personal Tour Guide
Ask me questions while you tour the home.