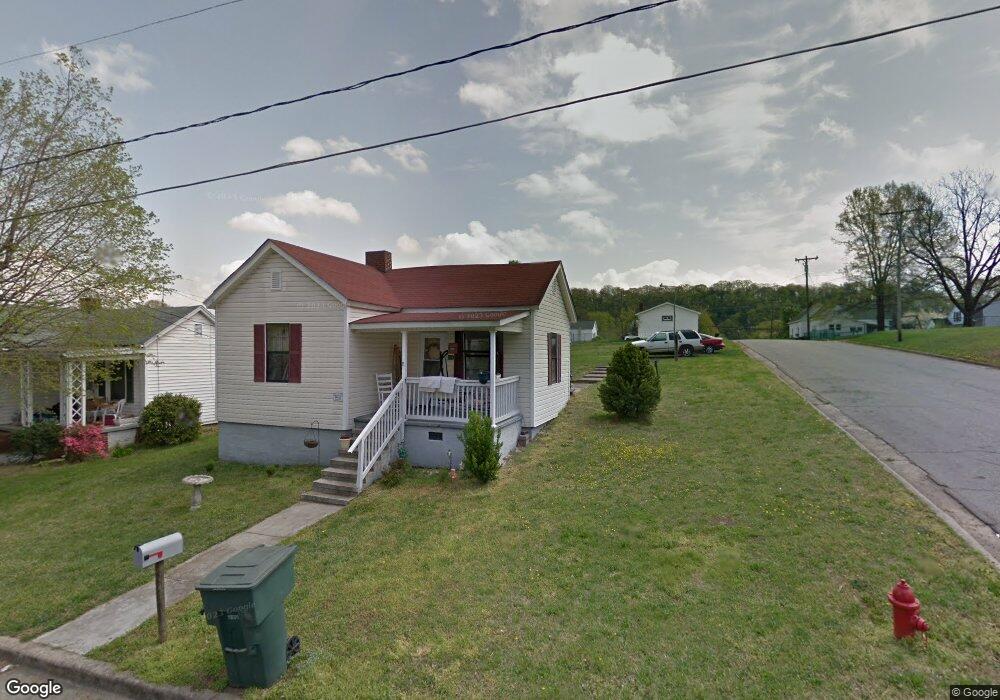
301 N 3rd Ave Mayodan, NC 27027
Estimated Value: $91,563 - $138,000
Studio
--
Bath
896
Sq Ft
$121/Sq Ft
Est. Value
About This Home
This home is located at 301 N 3rd Ave, Mayodan, NC 27027 and is currently estimated at $108,391, approximately $120 per square foot. 301 N 3rd Ave is a home located in Rockingham County with nearby schools including Western Rockingham Middle School, John W Dillard Elementary, and John W. Dillard Academy.
Ownership History
Date
Name
Owned For
Owner Type
Purchase Details
Closed on
Nov 16, 2023
Sold by
Hennig William W
Bought by
Casper Fotini
Current Estimated Value
Purchase Details
Closed on
Oct 14, 2021
Sold by
Hennig William W
Bought by
Hennig William W and Johnson David P
Purchase Details
Closed on
Feb 22, 2010
Sold by
Yarbrough Jack J and Cardwell James R
Bought by
Hennig William W
Home Financials for this Owner
Home Financials are based on the most recent Mortgage that was taken out on this home.
Original Mortgage
$42,500
Interest Rate
5%
Mortgage Type
Unknown
Create a Home Valuation Report for This Property
The Home Valuation Report is an in-depth analysis detailing your home's value as well as a comparison with similar homes in the area
Home Values in the Area
Average Home Value in this Area
Purchase History
| Date | Buyer | Sale Price | Title Company |
|---|---|---|---|
| Casper Fotini | $18,000 | None Listed On Document | |
| Hennig William W | -- | Garnello And Associates Pc | |
| Hennig William W | $50,000 | None Available |
Source: Public Records
Mortgage History
| Date | Status | Borrower | Loan Amount |
|---|---|---|---|
| Previous Owner | Hennig William W | $42,500 |
Source: Public Records
Tax History
| Year | Tax Paid | Tax Assessment Tax Assessment Total Assessment is a certain percentage of the fair market value that is determined by local assessors to be the total taxable value of land and additions on the property. | Land | Improvement |
|---|---|---|---|---|
| 2025 | $758 | $60,881 | $5,445 | $55,436 |
| 2024 | $758 | $60,881 | $5,445 | $55,436 |
| 2023 | $717 | $51,557 | $4,950 | $46,607 |
| 2022 | $701 | $51,557 | $4,950 | $46,607 |
| 2021 | $683 | $51,557 | $4,950 | $46,607 |
| 2020 | $685 | $51,557 | $4,950 | $46,607 |
| 2019 | $686 | $51,557 | $4,950 | $46,607 |
| 2018 | $587 | $44,021 | $7,950 | $36,071 |
| 2017 | $586 | $44,021 | $7,950 | $36,071 |
| 2015 | $592 | $44,021 | $7,950 | $36,071 |
| 2014 | -- | $44,021 | $7,950 | $36,071 |
Source: Public Records
Map
Nearby Homes
- 401 N 3rd Ave
- 209 N 2nd Ave
- 7th S 12th Ave
- 507 W Washington St
- 532 Cedar Mountain Rd
- 806 N 7th Ave
- 101 Ayersville Rd
- 218 W Washington St
- Lot 1 12th Ave
- 112 Taft St
- 00 Poole Rd
- 17.2 Acres Davie Ln
- 8.6 Acres Davie Ln
- 411 W Gene Hairston St
- 202 W Tidball Ave
- 44 +/- AC Island Dr
- 812 Dan Valley Rd
- 21 Highway 704
- 177 Green Mallard Way
- 222 Rose Wind Way
Your Personal Tour Guide
Ask me questions while you tour the home.